Author Archives: Keith M. Bower

Using Prior Knowledge to Estimate Long-Term Variation

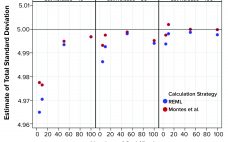
A reasonable estimate of long-term variation for a biopharmaceutical product critical quality attribute (CQA) can be challenging to justify, especially in the early stages of a product’s lifecycle when only limited data are available. However, if the combination of product and analytical method reasonably can be matched with historical data, prior knowledge can provide an estimate of a value. This variation estimate could be used to assist in risk assessments related to continued process verification (CPV) activities, including control charting…

Practical Considerations for Statistical Analyses in Continued Process Verification

Several statistical techniques can be used to assist in monitoring biopharmaceutical product quality attributes as part of continued process verification (CPV) activities. These include run charts, control charts, and capability analyses. Below, I provide an overview and recommendations on statistical strategies when developing a CPV program, considering the expected behavior of manufacturing results in the biopharmaceutical industry. Presence of Autocorrelated Data In a previous study, I highlighted the tendency for data to be positively autocorrelated (values are closely related to…

Run Rules with Autocorrelated Data for Continued Process Verification

Control charts can be used to assist in monitoring of biopharmaceutical product quality attributes as part of continued process verification activities. A number of tests known as run rules have been developed to assess whether biomanufacturing processes remain in statistical control. In practice, results for such attributes can be positively autocorrelated. Simulated data are used to assess the performance of run rules with autocorrelated data to assist in determining risk–reward profiles for process monitoring. Autocorrelated Data The tendency for data…

Biopharmaceutical Product Specification Limits and Autocorrelated Data

Calculations, including statistical tolerance intervals, can assist in the development and revision of specification acceptance criteria. Manufacturing results for attributes of a biopharmaceutical product can be positively autocorrelated. The sample standard deviation — calculated from limited, positively autocorrelated data — tends to underestimate the long-term process standard deviation (1). In this article, simulated data are used to assess the relative performance of statistical tolerance intervals, intervals calculated using the minimum process performance index Ppk approach, and the sample range. Prevalence…

Determining Control Chart Limits for Continued Process Verification with Autocorrelated Data

Control charts are used to assist in process monitoring activities. They use an estimate of central tendency (the overall mean) and variation (the standard deviation). Sample standard deviations (S) tend to underestimate process standard deviations (σ) when they are calculated using limited sample sizes of independent results (1). For this reason, the unbiasing constant c4 is used as a divisor when calculating Shewhart control-chart limits. If data used for control charting are positively autocorrelated, that tends to underestimate σ further…

Certain Approaches to Understanding Sources of Bioassay Variability

During lifecycle development of a biological assay (bioassay), identifying and reducing sources of variability might be required to improve method performance. Here I recommend some statistical and graphical approaches (consistent with USP <1033>) for practitioners to identify variation from experimental results (1). Sources of Variation in a Bioassay To correctly identify sources of variation in a bioassay, analysts must consider how that bioassay is to be executed. In particular, the experience and technical expertise of each analyst expected to execute…

Statistical Assessments of Bioassay Validation Acceptance Criteria

Analytical linearity as well as assessments of precision and accuracy determine the range for a bioassay (1). USP <1033> recommends comparing confidence intervals (CIs) against target validation acceptance criteria in a bioassay validation exercise, but there are no clear guidelines for determining the criteria (2). Here I address several aspects of a bioassay validation, namely • Linearity (coefficient of determination (R2), slope, and intercept parameters) • Accuracy (%relative bias, %RB) • Precision (percent coefficient of variation, %CV) CIs for the…

The Relationship Between R2 and Precision in Bioassay Validation

Analytical linearity along with assessments of precision and accuracy determine the range for bioassays (1). Practitioners can include coefficient of determination (R2) criteria from a linearity study in the bioassay validation protocol. Herein I illustrate the relationship of R2 to study design and analytical method variation. Overview of the Simple Linear Regression Model Dilutional linearity assesses the “ability (within a given range) of a bioassay to obtain measured relative potencies that are directly proportional to the true relative potency of the…

A Statistical Approach to Assess and Justify Potential Product Specifications

As stated in ICH Q6B, specifications are critical quality standards that are both proposed and justified by drug product manufacturers. Xiaoyu et al. provide information on several statistically based strategies to establish specification acceptance criteria (SAC) (1). Here we address an alternative approach to relate proposed SAC for quantitative data to relevant lot history. In particular, proposed SAC can be derived in part by using calculated limits for which the lower bound of an approximate 95% confidence interval for the…