 The Chinese hamster ovary (CHO) cell line is the most prevalent biopharmaceutical expression system and has been proven safe for commercial production of protein therapeutics (1). However, even after multiple purification steps, biopharmaceuticals contain residual host-cell protein (HCP) impurities that pose a potential safety risk to patients (2). Health authorities demand close monitoring of HCP impurities and require sensitive analytical methods with high coverage: the ability to detect a broad range of HCP impurities (3, 4).
Polyclonal sandwich immunoassays are used commonly for that purpose because they confer higher sensitivity than other analytical methods (5). Pharmacopoeial guidance on HCP assays has been published recently (6, 7). The industry distinguishes three types of HCP immunoassays:
- commercially available (âgenericâ) assays publicly available as test kits
that are intended to work broadly across similar expression hosts, such as different CHO cell lines - process-specific (âproduct-specificâ) assays developed âtaking into account the specificity of the production processâ (7) by mimicking a productâs manufacturing process in preparing an antigen for raising polyclonal anti-HCP antibodies
- platform assays, in which âthe same set of an HCP standard and antibodies is developed with a companyâs proprietary host-cell strain and used broadly within a type (e.g., CHO) across several products when the upstream conditions are similarâ (6).
A platform assay confers advantages similar to those of a commercially available assay: It is ready from the onset of product development, makes analytical results comparable across product development stages (as well as between different products), and reduces analytical development effort. At the same time, a platform assay eliminates the potential drawbacks of generic assays. It gives a biomanufacturer control over assay reagent supply and lot-to-lot consistency. Manufacturers and health authorities seem to be increasingly skeptical toward generic assays (8â10). Depending on the expression host and manufacturing process, commercially available kits can be limited in their utility by poor sensitivity and coverage. Finally, a platform assay can be customized for a given biomanufacturerâs production process like a process-specific assay.
One recent publication describes preparation of antigens to develop a CHO HCP platform assay (11). Here we report our full development of such an assay, which to our knowledge is the first report of this type describing reagent preparation and characterization in detail. We compared our newly developed platform assay to a generic assay and observed better sensitivity and coverage with the former. Finally, we confirmed the broad applicability of our platform assay for process control and release testing of products from different CHO cell lines.
Materials and Methods
Generation of CHO HCP Antigen: We used parental CHO cell line 1 to generate our HCP antigen. Shake-flask cultures were pooled and expanded in a 50-L steel bioreactor, then in a 300-L steel bioreactor run in fed-batch mode with glutamine and glucose feeding. After the culture was harvested at 45% viability, harvested material was filtered to remove cells and debris and then diafiltrated against Gibco phosphate-buffered saline (PBS) from Thermo Fisher Scientific. The resulting suspension was stored at 4 °C overnight before sediment was removed using Kleenpak 0.2-”m ultrafiltration (Pall Life Sciences). Total protein concentration was quantified using a Micro BCA protein assay kit from Pierce. Aliquots were stored at â60 °C or below.
Immunization and Preparation of Anti-HCP Antibodies: To generate antisera, we injected rabbits and goats intramuscularly with the HCP antigen and determined titers using direct enzyme-linked immunosorbent assay (ELISA) with HCP coated on its solid phase. Reported titer was defined as the highest serum dilution that produced an absorbance signal at least twofold of a blank.
We prepared capture antibodies using affinity chromatography of pooled antisera. For the affinity column, HCP antigen was coupled to a bromocyan-sepharose resin from GE Healthcare; detection antibody came from the capture antibody stock. After ammonium-sulphate precipitation, pellets were redissolved in 0.1 M sodium-acetate and 0.1 M NaCl at pH 4.5 and incubated with Fluka pepsin (50 ”g/mg protein) from Honeywell for 40 hours at 37 °C. We stopped that reaction by adding 7% (v/v) of 2 M Tris at pH 9.0. The resulting solution was dialyzed against 50 mM potassium phosphate at pH 7.4, then incubated for four hours at room temperature (RT) with a 40-fold molar excess of the biotinylation reagent biotinamidohexanoic acid N-hydroxysuccinimide ester from Sigma-Aldrich.
We purified F(abâČ)2 fragments by affinity chromatography as described above, then dialyzed the results against Tris-buffered saline (TBS) before aliquotting and storing them at â€60 °C.
Western Blots: For one-dimensional (1D) blots, we separated 6 ”g/lane CHO HCP on a 4â12% bis-Tris mini gel (NuPAGE) and transferred that onto a polyvinylidene fluoride (PVDF) membrane. To do so, we used an iBlot gel transfer device according to the manufacturerâs instructions (all Invitrogen from Thermo Fisher Scientific).
For two-dimensional (2D) blots in small format, we desalted HCP samples using a GE Healthcare 2D clean-up kit and then dissolved them in rehydration buffer containing 7 M urea, 2 M thiourea, 4% (w/v) CHAPS detergent, 1% (w/v) dithiothreitol (DTT), 2 % (v/v) Pharmalytes electrolytes (GE Healthcare), and Complete protease inhibitor (Roche). We loaded 6-”g samples on immobilized pH 4â7 gradient strips (IPGs) from GE Healthcare. Isoelectric focusing ran on an Ettan IPGphor instrument (also GE Healthcare) until reaching 8 kVh.
We incubated the IPG strips for 15Â minutes in sodium-dodecyl sulfate (SDS) equilibration buffer â 6 M urea, 75 mM Tris-HCl, 29.3% (v/v) glycerol, 2% (w/v) SDS, and 0.002% (w/v) bromophenol blue at pH 8.8 â with 10Â mg/mL DTT added. After 15Â minutesâ treatment with SDS equilibration buffer containing 25 mg/mL iodoacetamide, equilibrated strips were loaded onto the second-dimension gel (Invitrogen NuPAGE 4â12% bis-Tris mini gels in MOPS running buffer from Thermo Fisher Scientific), then electrophoresed at 5Â mA for 30 minutes and at 25 mA for ~150 minutes. Western blotting was performed as described above.
For total protein staining, we used colloidal gold from Bio-Rad Laboratories according to the manufacturerâs instructions. With immunostaining on the same membrane, control experiments demonstrated that the gold stain did not interfere with subsequent immunostaining (not shown). After overnight incubation at 2â8 °C with HCP antibody (5 ”g/mL), we washed the membranes in PBS with 0.1% Tween 20 (PBST) from Spring Bioscience. Goat antirabbit infrared fluorescent dye 680-nm conjugate or infrared dye 800-nm conjugated streptavidin (both from Li-Cor, 1:20,000 dilution) was added for an hour at room temperature (RT), followed by washing. A Li-Cor Odyssey infrared fluorescence scanner recorded the immunostaining; a Bio-Rad lightimage scanner recorded the colloidal gold total-protein staining. PDQuest software from Bio-Rad automated the image analysis, with manual editing to correct for false positives (e.g., membrane scratches) and false negatives (faint spots missed by the software).
For 2D difference gel electrophoresis (DIGE) Western blots in large format, we desalted 50-”g samples using the GE Healthcare 2D clean-up kit and labeled them with Cy5 (also from GE Healthcare) before applying them to pH 3â10 IPG strips also from GE). Proteins were separated in two dimensions by isoelectric focusing on an Ettan IPGphor 3 instrument (GE) and SDS polyacrylamide gel electrophoresis (PAGE) on an Ettan DALTsix electrophoresis unit (GE), then transferred to nitrocellulose membranes by TE77PWR semi-dry Western blotting (GE). After the blocking and washing steps, we incubated the membranes for two hours with 20 ”g/mL anti-HCP antibody, then washed and incubated them for an hour with 1 ”g/mL antirabbit-IgG-Cy3 conjugate. After more washing, blots were scanned for Cy3 and Cy5 fluorescence on a Typhoon FLA 9500 fluorescence scanner (GE). For electronic spot detection, we used ImageMaster 2D Platinum software (GE), manually removing spots identified as artifacts of dust particles, membrane damage, or background.
Sandwich Immunoassay: We diluted our capture antibody to 2 ”g/mL in coating buffer (0.2 M sodium carbonate-bicarbonate buffer at pH 9.4 from Pierce) and added 100 ”L to each well of a Nunc Maxisorp microplate. After incubating the plate overnight at 2â8 °C, we discarded the coating solution and added 200 ”L/well of TBST assay buffer from Spring Bioscience with 0.1% bovine serum albumin (BSA) from Sigma for 1â3 hours. After washing the plate with TBST, we added 100 ”L/well of the standard, blank, and samples before incubating it for two hours at RT, followed by another TBST wash step.
Detection antibody was diluted to 500 ng/mL in assay buffer. We added 100 ”L/well and incubated the plate for 1.5 hours at RT. After another TBST wash step, we added streptavidin-peroxidase (Jackson Immunoresearch) at a ratio of 1:80,000 and incubated the plate for 20 minutes. Then we added a BM Blue tetramethylbenzidine substrate (Roche) and incubated for up to 30 minutes, stopping the reaction by adding 2 M sulfuric acid (JT Baker). A Spectramax plus microplate reader measured absorbance at 450 nm, with the standard curve fitted using a quadratic fitting procedure (Softmax Pro).
Results
HCP Antigen Preparation and Immunization: We used parental CHO cell line 1 for production of HCP antigens. They came from cell-free supernatant of a 300-L bioreactor run and were diafiltered for debris removal.
For immunization, we evaluated both rabbits and goats as potential hosts, testing constant and increasing amounts of antigen. Both boost strategies yielded similar antibody titers (not shown), so we immunized with constant amounts of antigen. Titers were determined on every bleed for each animal. Rabbits gave antisera titers of ~1 Ă 105 in the first bleed and 2 Ă 105 in the second, whereas goats yielded lower antisera titers (1â3 Ă 104). The former reached maximum titers at the second bleed, remaining constant from that point onward. Goat antisera titers remained constant or slightly decreased from the second bleed onward. After analytical testing, we pooled all bleedings by species and used those pools as starting material for preparation of our HCP-specific capture and detection antibodies.

Figure 1: Western blot with antisera from rabbits and goats; molecular weight standard was loaded in lane 1 and CHO #1 HCP in lanes 2â9. Lanes 1 and 2 were gold stained for total protein; subsequent lanes were immunostained with anti-HCP antisera from the indicated animals.
We further characterized the antisera by Western blotting of the HCP antigen (Figure 1). With both rabbit and goat antisera, HCP bands were stained over a broad range of molecular weights (MWs). Goat antisera gave less intense immunostaining in the lower MW range. Furthermore, we discovered a heterogeneous immunostaining pattern among individual goats. By contrast, immunostaining was highly comparable among different rabbits. Together with our evaluation of the purified antibodies (see below), these results informed our decision to proceed with anti-HCP antibodies from rabbit antisera.
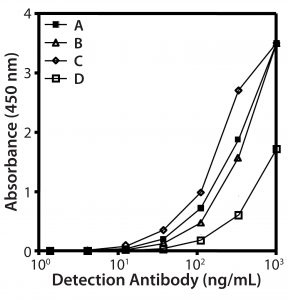
Figure 2: Reactivity of different biotinylated antibody species in direct ELISA; (A) goat and (B) rabbit IgGs, (C) rabbit and (D) goat F(abâ)2fragments
Preparation of Anti-HCP Antibodies: We prepared our capture antibody from antiserum using HCP affinity chromatography, testing four different preparations (rabbit or goat antibodies, each as full-length IgGs or F(abâČ)2-fragment) by direct ELISA with HCP coated to the plate (Figure 2). Goat and rabbit IgGs showed similar reactivity (curves A and B). F(abâČ)2-fragments from rabbits gave the best signal to background ratio (curve C). Of all preparations, the goat F(abâČ)2-fragments were least reactive (curve D). Compared with the reactivity of goat IgG (curve A), that indicates that goat antibodies lose reactivity by peptic digestion. Based on these data, we selected the rabbit F(abâČ)2-fragment as a detection antibody for development of our platform assay.

Table 1: Enzyme-linked immunosorbent assay (ELISA) standard curve comparison of detection antibody preparations IâIV; dynamic range = mean absorbance of 32 ng/mL standard minus mean absorbance of blank; signal to background = mean absorbance of 32 ng/mL standard (minus blank) divided by mean absorbance of blank. Values are mean results from two independent assays. P = precipitation; A = affinity chromatography; B = biotinylation; C = cleavage.
We tested different detection antibody purification processes for their influence on sandwich ELISA performance (Table 1). Process IV yielded detection antibodies with the best dynamic range and signal-to-background ratio. But without the second affinity purification step included at the end of that process, antibodies performed poorly (process 3), most probably due to remaining biotinylated Fc-fragments and/or pepsin.
Western Blot Comparison of Platform Anti-HCP Antibodies with Commercially Available Reagents: We compared the immunoreactivity of obtained platform anti-HCP antibodies with those from three CHO HCP kits (catalog numbers F015, CM015, and F550) purchased from Cygnus Technologies. The corresponding separately available antibodies used for Western blotting are C0016-AF, M0016-AF, and 3G0016-AF, respectively. In a first step, we compared immunoreactivity by one-dimensional (1D) Western blotting, with CHO 1 HCP antigen as our analyte (Figure 3). Immunostaining of platform capture and detection antibodies covered a broad range of HCPs; the three generic antibodies revealed fewer bands and/or stained less intensely.

Figure 3: Western blots of platform and generic anti-HCP antibodies; in lane 1, molecular-weight (MW) standard was loaded. All other lanes were loaded with CHO #1 HCP antigen. Lanes 1 and 2 were gold stained for total protein; subsequent lanes were immunostained with the indicated anti-HCP antibodies.
For a quantitative comparison, we performed 2D PAGE and Western blotting. (Here, we tested only Cygnus antibodies C0016-AF and 3G0016-AF because the 1D Western blots already showed that antibody M0016AF was not superior to them for our purposes). As revealed by total protein stain, 3G0016-AF and C0016-AF antibodies detected 29% and 33% of HCP spots, platform capture antibodies detected 41â46%, and platform-detection antibodies detected 57â64% (Table 2). These blots are not shown. We tested two different lots of capture and detection antibodies. Capture antibody lot 1 came from a single antiserum batch; capture antibody lot 2 and the two detection antibody lots came from the antiserum of a subsequent immunization. Each coverage value represents the mean of at least four determinations.
Results were consistent among lots of capture and detection antibody, but it was surprising that the latter yielded higher coverage than the former, even when coming from the same antiserum. A possible explanation for that bias is the use of different secondary reagents in our

Table 2: Coverage (number of spots in immunostain divided by number of spots in total protein stain) of platform and commercial anti-HCP antibodies; Western blots in small format were gold stained for total protein and immunostained with fluorescence-dye labelled secondary reagent. 2D DIGE Western blot in large format was performed for the platform capture antibody lot 2, with Cy5 (total protein) and Cy3 (immunostain) fluorescence detection.
Western blot. Streptavidin-peroxidase conjugate was used as a secondary reagent in combination with the F(abâČ)2 detection antibody and might confer higher sensitivity by higher affinity and binding stoichiometry than goat antirabbit peroxidase conjugate, which we used with the capture antibody. Therefore, it may be more appropriate to compare coverage found for the capture antibody with that of the Cygnus antibodies, for which a donkey antigoat POD conjugate was used as secondary reagent. Even so, we confirmed the platform reagentsâ higher immunoreactivity compared with that of the Cygnus anti-HCP antibodies by 2D Western blots.
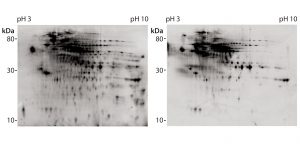
Figure 4: 2D difference gel electrophoretic (DIGE) Western blot with platform assay capture antibody (lot 2); CHO 1 HCP antigen was labeled with Cy5 dye for total protein staining (left); for immunostaining (right), antirabbit-IgG-Cy3 conjugate was used as secondary reagent.
We further analyzed coverage for platform capture antibody lot 2 using 2D DIGE and Western blotting, using large gels and membranes. We measured total protein stain and immunostain with Cy5 and Cy3 dye labels with one blot membrane scan for two fluorescence channels (Figure 4). Coverage of 83% was determined (Table 2) from a single run only because of the high antibody consumption. However, we confirmed the coverage range of the antibody lot with another antigen preparation, determined at 86%. Those results demonstrate that the platform antibodies have broad immunoreactivity and recognize the majority of HCP species from the CHO 1 HCP antigen. The difference compared with the coverage value determined using small immunoblots (Table 2, 46% for capture antibody lot 2) further highlights that coverage results are strongly method dependent.
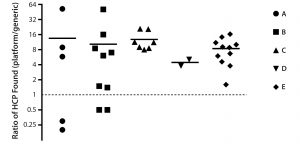
Figure 5: HCP analysis of process-intermediate samples from five different products (AâE); for each product, ratios (platform assay/generic assay) of HCP concentrations found at different downstream purification process steps are plotted with symbols; mean ratios for each process are plotted as dashes. Data are shown on a binary logarithm scale.
Comparison of Assay Performance in Process Monitoring: We assessed performance of our ELISA based on platform anti-HCP antibodies by analyzing 34 downstream process-intermediate samples from five monoclonal antibodies (MAbs) produced in four different CHO cell lines: products B and D, CHO 1; product A, CHO 2; product C, CHO 3; product E, CHO 4. The platform assay detected an average four- to 14-fold higher HCP levels than did Cygnus kit F015 (Figure 5). Across all samples, the mean ratio of HCP concentrations between the two assays was 10:1.

Table 3: Process intermediate HCP testing from two batches of product D; samples from four downstream purification process intermediates were tested head-to-head with the platform and generic (Cygnus kit #F015) assays.
Table 3 gives a more detailed example for process intermediates of two batches from the same product. From most downstream purification steps, the platform assay detected an order of magnitude higher HCP concentration than the generic assay. Consequently, the platform assay could determine HCPs in all samples from harvest to drug substance, making it more suitable for process control. Note that the platform assay could quantify HCP in final drug substance that was below the quantification limit of the generic ELISA. Those data demonstrate that for a representative set of process intermediates from MAbs produced in different CHO cell lines, the platform assay is more sensitive than the generic assay.
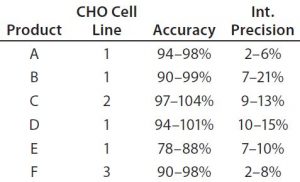
Table 4: Early validation of the platform ELISA for six monoclonal antibodies; product coding with letters AâF does not correspond to the product coding in Figure 5. Assays were performed with drug substance concentrations of 0.1 mg/mL (products E and F), 0.5 mg/mL (products A and C), and 1.0 mg/mL (products B and D) at which specificity (lack of matrix interference) was reached. Validation parameters were assessed at six HCP levels by two analysts in three independent assays. Limit of quantitation (LoQ) = 1.25 ng/mL; range = 1.25â25.0 ng/mL
Platform Assay Validation: After initial testing, the platform assay underwent early validation for clinical-phase drug substance release testing of six MAb products produced in three different CHO cell lines. The assay showed similar performance for all six products (Table 4). A limit of quantitation (QL) of 1.25 ng/mL was reached in all cases. Linearity, accuracy, and precision fulfilled acceptance criteria over a range of 1.25â25 ng/mL. Specificity (lack of matrix interference) was demonstrated in a background of 0.1â1 mg/mL drug substance. These validation data for a representative set of MAbs from different CHO cell lines support the broad applicability of our platform assay for drug-substance release testing.
Discussion
Generic HCP assays offer the advantage commercial availability for analytical testing from the onset of biopharmaceutical product development. They can save time and cost for analytical method development and help make analytical results comparable throughout a productâs lifecycle as well as among different products. However, sponsors and regulators have found insufficient sensitivity and immunoreactivity among commercially available assays for more advanced applications (8â10). Therefore, we developed a platform CHO HCP immunoassay and assessed it against commercially available generic assays.
Preparation of HCP immunoassay reagents is complex, and multiple parameters can influence their fitness for use (sensitivity and HCP coverage). We tested two different immunization hosts and found that the immune response of goats was weaker and more variable than of rabbits. So we prepared the anti-HCP reagents for our platform assay from rabbit antisera. To our knowledge, no such comparative data have been published previously; it would be of interest if the suboptimal response of goats to CHO immunogen is a widespread observation.
We purified anti-HCP antibodies from both animal species and tested them as detection antibodies by direct ELISA, also comparing full-length IgGs against F(abâČ)2 fragments. Goat and rabbit IgG showed very similar ELISA reactivity to the CHO antigen despite the lower titer and weaker Western blot staining of goat IgG. Thus Western blot and ELISA do not necessarily correlate. Itâs possible that a few abundant or high-affinity antibodyâantigen pairs dominate the ELISA response for samples with high HCP content (e.g., cell culture harvest). Broad HCP coverage could confer an advantage for samples containing fewer and less abundant HCPs (e.g., drug substance).
Health authorities regularly request that biomanufacturers determine HCP coverage for qualifying HCP assay reagents. Although the concept is clear â relating the number of immunostained HCP spots to the number obtained with a total protein stain â the methodology lacks standardization, and multiple method parameters influence the result obtained. We analyzed coverage for two lots each of platform capture and  detection antibodies purified from the same antiserum, achieving similar results among those lots. That indicates reproducibility of antibody preparations as well as of coverage analyses. However, we found a ~20 % difference in coverage between capture and detection antibodies, most likely originating from different secondary Western blot reagents.
Furthermore, switching from small to large Western blots and modifying the staining techniques changed the coverage we could determine for the platform capture antibody from 46% to 83%. The former value suggests suboptimal coverage; the latter indicates that the antibodies broadly recognize the majority of HCPs. Those results demonstrate that absolute numerical coverage measurements should be interpreted with caution. Comparisons among different anti-HCP antibody reagents can be meaningfully made only in head-to-head comparisons using the same method. From such a comparison, we found that our platform antibodies have a higher coverage and stain more intensely than the commercially available reagents we tested. The moderate difference in coverage (at best twofold) by comparison with the pronounced ELISA difference (about tenfold on average) suggests that the coverage parameter is not the only factor that influences ELISA performance.
We compared our platform assay to a commonly used generic assay with a set of process intermediates from five MAbs. The platform assay showed an average tenfold higher sensitivity, enabling more rigorous monitoring of HCP reduction from harvest to final product. The commercial assayâs relatively poor performance could have several causes:
- a different CHO cell line or mixture of cell lines used to produce HCP antigen (its origin is not disclosed) yielding anti-HCP antibodies that are not well suited for detecting CHO 1 HCP â however, this does not match the finding that transcription and HCP profiles of different CHO cell lines are very similar (12â14) or correspond to the observation that our platform assay shows good sensitivity for process samples and drug substance from CHO cell lines other than CHO 1
- a different procedure used to prepare HCP antigen â e.g., whole-cell lysate used for the generic assay, whereas our antigen was prepared from cell culture supernatant â or different cell culture parameters (e.g., cell viability at harvest) (15â17) could have contributed to observed differences in sensitivity, which emphasizes the importance of tailoring a platform assay to a given biomanufacturing process
- inefficacy of the immunization procedure or host species â the generic antibodies tested came from goats, whereas the platform antibodies came from rabbits, with the latter producing superior antisera in our hands.
Besides detecting HCP over a broad range of concentrations for process control, our platform assay also is well suited for sensitive HCP testing in drug-substance release. We obtained similar early validation results for six different MAb drug substances expressed in CHO 1 and two other CHO cell lines. Further, we characterized the platform assay to demonstrate its suitability for release testing of those and other CHO products by probing the assay accuracy/trueness with orthogonal measures, by proteomic comparison of HCP standard and production harvests, and by coverage determination of process samples (manuscript in preparation). We have concluded that this platform assay is widely applicable to CHO-derived biopharmaceuticals and provides a versatile and sensitive tool for HCP monitoring.
References
1 Wurm FM. Production of Recombinant Protein Therapeutics in Cultivated Mammalian Cells. Nature Biotechnol. 22(11) 2004: 1393â1398.
2 de Zafra CL, et al. Host Cell Proteins in Biotechnology-Derived Products: A Risk Assessment Framework. Biotechnol. Bioeng. 112(11) 2015: 2284â2291; doi:10.1002/bit.25647.
3 CBER. Points to Consider in the Manufacture and Testing of Monoclonal Antibody Products for Human Use. US Food and Drug Administration: Rockville, MD, 28 February 1997.
4 ICH Q6B: Test Procedures and Acceptance Criteria for Biotechnological Biological Products. US Fed. Reg. 64(159) 1999: 44928â44935.
5 Anicetti VR, et al. Immunoassay for the Detection of E. coli Proteins in Recombinant DNA Derived Human Growth Hormone. J. Immunol. Meth. 91(2) 1986: 213â224.
6 <1132> Residual Host Cell Protein Measurement in Biopharmaceuticals. US Pharmacopeia 39, 2016: 1416â1436.
7 European Directorate for the Quality of Medicines 2.6.34: Host-Cell Protein Assays. European Pharmacopoeia 9.1, 2017: 4041â4045.
8 CDERâs Shacter on Evaluating Host Cell Proteins. The Gold Sheet 38(9) 2004: 14â18.
9 Schwertner D, Kirchner M. Are Generic HCP Assays Outdated? BioProcess Int. 8(5) 2010: 56â61.
10 Savino E, et al. Development of an In-House, Process-Specific ELISA for Detecting HCP in a Therapeutic Antibody, Part 2. BioProcess Int. 9(4) 2011: 68â75.
11 Kochanowski N, et al. Host Cell Protein Platform Assay Development for Therapeutic MAb Bioprocessing Using Mammalian Cells. BMC Proc. 9(Sup 9) 2015: P21; doi: 10.1186/1753-6561-9-S9-P21.
12 Krawitz DC, et al. Proteomic Studies Support the Use of Multi-Product Immunoassays to Monitor Host Cell Protein Impurities. Proteomics 6(1) 2006: 94â110.
13 Blas M, et al. Transcriptomic Variation Between Different Chinese Hamster Ovary Cell Lines. Biotechnol. Lett. 37(9) 2015: 1737â1745; doi:10.1007/s10529-015-1850-0.
14 Yuk IH, et al. More Similar Than Different: Host Cell Protein Production Using Three Null CHO Cell Lines. Biotechnol. Bioeng. 112(10) 2015: 2068â2083; doi:10.1002/bit.25615.
15 Grzeskowiak JK, et al. 2D DIGE to Expedite Downstream Process Development for Human Monoclonal Antibody Purification. Prot. Expres. Purif. 66(1) 2009: 58â65.
16 Jin M, et al. ProïŹling of Host Cell Proteins By Two-Dimensional Gel Electrophoresis (2D-DIGE): Implications for Downstream Process Development. Biotechnol. Bioeng. 105(2) 2010: 306â316; doi:10.1002/bit.22532.
17 Tait AS, et al. Host Cell Protein Dynamics in the Supernatant of a MAb Producing CHO Cell Line. Biotechnol. Bioeng. 109(4) 2012: 971â982; doi:10.1002/bit.24383.
Both Stefan Haemmig and Josiane Tenud contributed equally to this paper; Maria Brauchle is global technical project leader, Thomas Millward is group head, and corresponding author Oliver Anderka is bioanalytics team leader at Novartis Pharma AG, Biopharmaceutical Process and Product Development, CH-4057 Basel, Switzerland; oliver.anderka@novartis.com. Stefan Sommerschuh is group leader at BioGenes GmbH, D-12555 Berlin, Germany.
