No longer are scientists bound to the time-consuming, error-prone use of dilution factors and fixed-pathlength measurements in determining the concentration of an analyte in solution. Using the slope spectroscopy technique, the Solo VPE system (from C Technologies) offers a new method of determining analyte concentration based on the Beer–Lambert law and slope derived from absorbance measurements made at multiple pathlengths (1).
Mathematics: The Beer–Lambert law is expressed as A = αlc, where A is the measured absorbance, α is the molar absorption coefficient, l is the pathlength, and c is the sample concentration. This equation can then be rearranged for use with slope spectroscopy: A/l = αc. For measurements comparing slope and pathlength, a linear regression equation is written as A = ml + b, where m is the slope of the regression line, and b is the y-intercept. Dimensional equality then allows for replacement of the left-hand side of the second equation above with the slope term from the third equation, yielding the following: m = αc. That resulting equation is referred to as the slope spectroscopy equation. It may be used to calculate a sample’s concentration — if the molar absorption coefficient is known — by dividing it into the slope as such: c = m/α. Similarly, if the sample concentration is known, we can calculate the molar absorption coefficient by dividing the slope by the concentration: α = m/c. Because pathlength selection is computer controlled and optimized based on the absorbance achieved, the above approach ensures rapid, accurate, and reproducible results. The Solo VPE spectroscopy system is equipped with a highly precise and repeatable computer-controlled linear stage that can quickly (<1 min) and accurately determine the ideal absorbance of a sample within the instrument’s linear range. It will then generate 5–10 absorbance measurements at successively larger or smaller pathlengths within that linear range. The software then calculates and plots a linear regression equation for the resulting absorbance and pathlength data to generate slope, intercept, and R2 values. Then the slope value is used — along with a user-supplied extinction coefficient for the compound of interest — to back-calculate the actual analyte concentration in the sample using the Beer–Lambert law. Background and Purpose: The biopharmaceutical industry’s need for fast, accurate concentration measurements of protein-containing products is of prime importance. Commonly referred to as “A280 analysis,” the protein-concentration assay is usually performed as an in-process test as well as a product-release test.
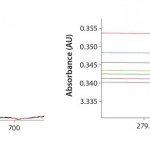
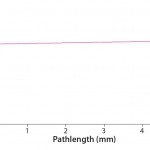
FIGURE 1: Analysis of buffer solution at multiple wavelengths and pathlengths — detailed scaled reference (no absorbance change)
During in-process A280 testing, the speed and turn-around time of results are nearly as critical as accuracy because manufacturing personnel are usually waiting for those data before they can continue processing. With traditional methodologies that rely on standard fixed-pathlength UV-visible spectroscopy, the turn-around time may be on the order of hours. That is attributed to the need for careful sample handling and preparation, particularly in creating the dilutions necessary for bringing samples into the linear range of an instrument’s calibration. Additionally, the error created when performing those dilutions can have a significant impact on the calculated sample concentration. As a result, the cumulative assay error sometimes may be larger than the permissible range of concentration variance from the target value, which calls into question the validity of the method itself.
Past attempts have been made at developing a variable-pathlength transmission cell for use with UV-vis spectrophotometry. One study involved a cell constructed from quartz- or silicon-windowed tubes and threaded glass connectors, with changes in pathlength made manually (2). Such a cell would be unsuited to the rapid, highly precise, and repeatable measurements required for drug product in-process testing.
The Solo VPE system greatly reduces those concerns. In nearly all cases, it can measure concentration without the need for dilution, which eliminates analyst-related errors associated with that part of sample preparation. The only analytical error thus associated with the assay is that related to the instrument itself, commonly referenced as ~2% (3). Similarly, a simplified sample preparation coupled with the rapid scan time of the Solo VPE system generates data within minutes rather than hours. That helps to reduce overall product-processing times, and in turn it reduces production costs.
Our intent is to provide evidence of the superior performance of this new variable-pathlength technology over the established methodology used throughout much of the biopharmaceutical industry. We accomplished this goal using several procedures typically involved in routine quantitative analytical method validation (4–6).
Materials and Equipment
We generated our data using a Solo VPE system installed on an Agilent Cary 50 UV-vis spectrophotometer (which serves as the light source). C Technologies supplied three sizes of quartz sample cups (large, small, and micro) and small plastic sample cups, which we used as needed based on sample concentration. The required sample volume (and hence sample cup size needed) is directly related to the expected sample concentration. Higher-concentration samples require a shorter pathlength (and hence less volume) than do those that are more dilute. So the small and micro-sized sample cups are used with highly concentrated samples. For dilute samples, a larger pathlength (and larger sample volume) must be used because light travels vertically through a sample with the Solo VPE system, and the height of the column of liquid in a sample vessel must exceed the maximum pathlength to be measured. The Solo VPE system accommodates a number of vessel sizes (including disposable plastic vessels) so that users can minimize required sample volumes. Typically, protein samples of 10–300 mg/mL can be measured using as little as 10–30 μL of sample.
We used two compounds for testing during this study. Data presented in Tables 2, 5 (drug product 2), and 6 were generated with a human anti-IL-6 monoclonal antibody. We used a 0.85% w/v saline buffer solution at pH 6.0 to prepare antibody solutions at the various concentrations required. Data presented in Tables 3, 4, and 5 (drug product 1) were generated using a fusion protein. We used a dilution buffer of 25 mM sodium phosphate and 10 mM sodium chloride at pH 7.5 for preparation of that protein at the various concentrations required.
All comparative data were generated using an Agilent 8453 UV-vis spectrophotometer equipped with a sample stage sized for standard 1-cm pathlength cuvettes. We used a masked, reduced-volume semimicro quartz cuvette (VWR Scientific, part #414004-070) for all measurements on the Agilent system to minimize the amount of sample required for each analysis.
Method and Results
Our laboratory has performed traditional UV-vis protein concentration measurements using spectrometers and methods based on a fixed pathlength (usually 1 cm). To get a sample’s expected concentration within the linear range of our instrument’s calibration, it usually has been necessary to perform at least one dilution. Calculations are based on the expected sample concentration and a target absorbance value, usually 1 absorbance unit (AU). We have used those to determine what dilution level would be required. If the expected concentration of the sample were unknown, then several scouting runs and experimental dilutions would be necessary to determine the approximate level of protein present.
Because of the physical properties of proteins in solution — particularly their viscosity and affinity for substrates such as glass and plastic — performing accurate dilutions is often a painstaking operation highly dependent on technique. Such problems become more prevalent with the increase in protein concentration. Highly concentrated solutions may require either serial dilutions or those made with exceedingly small sample volumes. Once a dilution has been made, the sample then must be thoroughly mixed. However, mixing must be slow and careful to prevent foaming and the introduction of air bubbles, which can create a light-scattering effect that can negatively affect absorbance measurements.
All those preparations can introduce additional errors, sometimes on the order of several percent. Errors associated with sample preparation vary based largely on analyst expertise, which creates a need for stringent analyst training and qualification programs. Analysts may struggle for weeks trying to develop the technique necessary to perform a traditional A280 analysis and generate accurate, repeatable results.
Once a sample is satisfactorily prepared, it can be transferred to a cuvette and placed on the instrument for analysis. In most cases, a special masked, reduced-volume cuvette must be used. Such cuvettes must be scrupulously cleaned and filled slowly to prevent air bubble formation. They also must be handled with care to prevent introduction to the outside glass of fingerprints, lint, or other contaminants that can cause absorbance or light-scattering issues.
Once a sample has been analyzed and its absorbance measured at 280 nm, protein concentration is calculated using the Beer–Lambert law and the molar extinction coefficient. However, those calculations usually are made based on three or more preparations at the same target dilution. Then a calculated average is used as the final concentration from those replicate analyses. Therefore, this methodology is time consuming and error prone to a degree that largely depends on an analyst’s level of expertise.
Slope Spectroscopy: By leveraging the variable-pathlength power of the Solo VPE system, which can operate at pathlengths as short as 0.005 mm and as large as 15 mm, measurements can be made within the linear range of the Beer–Lambert law for samples at concentrations that fall within the instrument’s operable range. It has been demonstrated that both low- and high-concentration samples may be analyzed with equal ease and performance.
The Solo VPE system has been used to analyze protein solutions at concentrations ranging as high as 300 mg/mL (7). Its search algorithm looks for an initial response of 1 AU (independent of sample concentration) and selects an optimal pathlength range and step size needed to plot a linear relationship between absorbance and pathlength. This feature is completely automated and does not require a preselected pathlength range or step size.
Use of the new system can greatly reduce or even eliminate many concerns with traditional A280 analysis. Because most materials can be run “neat” — without dilution — errors are removed that otherwise can be introduced during sample preparation and dilution. This also greatly reduces the processing time for analyzing samples, turning what previously took hours into minutes. Finally, the system’s ease of use and elimination of product-specific dilution buffer preparations have enabled us to draft a general method for use with just about any type of protein-containing solution. A library function within the system software allows for maintenance of product-specific parameters such as detection wavelengths other than 280 nm, scatter corrections, and so on.
Baseline/Buffer Correction: One of the unique advantages of slope spectroscopy methods is the fact that baseline correction frequently can be eliminated. The necessary conditions are simple to explain and easy to verify using the SoloVPE system. Baseline correction is not required when the absorbance response of buffer media does not display significant pathlength dependence. In other words, if absorbance measurements are made on the buffer media at different pathlengths — whether 0.010 mm, 1 mm, 8.4 mm, or 15 mm — the absorbance value reported will not appear to be a function of pathlength. Essentially, the absorbance result variation will be attributable only to instrument variation.
That can be easily verified using the SoloVPE system’s variable-pathlength technology because it is designed to make measurements at different pathlengths. Buffer media can be measured using the software’s Quick Slope function, which is designed to rapidly and automatically generate section data and a slope value. The slope value numerically measures a change in absorbance when the pathlength changes. If there is no change in the measured absorbance across multiple pathlengths, then there will be no appreciable slope. When the slope value is close to zero, the section plot will be a horizontal line, indicating that a baseline correction probably is not required. Figures 1 and 2 provide examples of analyses performed on a buffer solution for determining the change in slope.
Sample Measurement: In traditional protein concentration analyses, absorbance measurements are made using sample solutions of a single target concentration with a cell of fixed 10-mm pathlength. The target concentration is calculated to fit within the linear range of the spectrophotometer and achieved through a series of manually performed dilutions. Concerns associated with such measurements involve the introduction of error throughout dilution and additional time required for multiple preparations and analyses.
The Solo VPE system measures a sample in its neat, undiluted state to accurately determine protein concentration. Measurement accuracy is represented through data points taken at multiple pathlengths and the R2 value of the regression-line slope, which is typically at least 0.999. Laboratory experiments have demonstrated this system’s performance and equivalency with established protein-concentration analytical methods using “standard” UV-vis instrumentation and fixed-pathlength measurements. Table 1 summarizes the differences in instrumentation used.
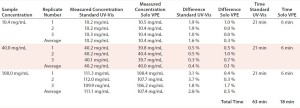
Accuracy: The first part of our study involved comparing the accuracy of each method and instrument type when measuring a single compound of interest over three different concentrations. Accuracy of a method is expressed as the closeness of agreement between a true or reference value and the measured value.
Measurements performed using the fixed-pathlength instrument required sample dilution using a positive-displacement pipettor and prepared buffer solution to achieve a target absorbance of 1 AU. All samples were analyzed on the Solo VPE system as-is, without preparation. We prepared three replicates and analyzed them for each concentration level, with percent difference from a target value and relative standard deviation (RSD) calculated for each set. Preparation and analysis time were also tabulated for each method (Table 2).
The Solo VPE system generated results that were slightly closer to the target values for each of the three product concentrations tested. However, the time expended to analyze those three products was significantly lower for that system than for the traditional method, primarily due to our ability to analyze each sample aliquot without first performing dilutions.
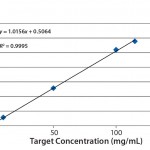
Linearity: Usually, linearity is defined as the ability of an assay to elicit test results that are directly (or by well-defined mathematical transformation) proportional to the concentration of an analyte in samples within a given range. For this experiment, we used serial dilutions from a stock solution of a protein compound at relatively high concentration to create standards at successively lower concentrations. With the stock solution at 115 mg/mL concentration, we prepared dilutions to 100, 50, 10, 5, 1, and 0.05 mg/mL. Then we analyzed each standard in duplicate on the Solo VPE system, plotting the average of those duplicate readings to form a curve (Figure 3). Considering the range involved and the error potentially involved with manual serial dilutions (particularly at the lowest concentrations), our achievement of a correlation coefficient of 0.9995 is notable, again demonstrating the Solo VPE system’s high level of performance.
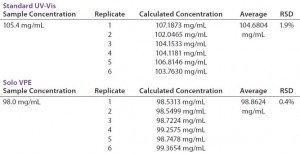
Precision — Repeatability: An analytical procedure’s repeatability is expressed by the closeness of agreement between a series of measurements obtained in multiple analyses of the same homogenous sample under prescribed conditions. Table 3 reports on six replicate analyses of a drug product using both the Solo VPE system and a fixed-pathlength instrument. As with the data generated in our accuracy test, this analysis of on the fixed-pathlength instrument required dilution with formulation buffer to a target concentration through positive-displacement pipetting. The tabular data show that, although each instrument generated results that would pass the typical acceptance criteria for precision testing (RSD ≤ 2%), the Solo VPE system generated results that were significantly closer in agreement over multiple replicates.
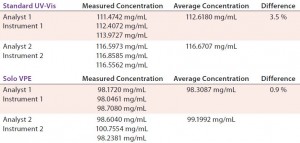
TABLE 4: Comparing precision (intermediate precision) data for Solo VPE and Standard UV-vis spectroscopy
Precision — Intermediate Precision: The intermediate precision of an analytical procedure is expressed by the closeness of agreement between a series of measurements obtained by the analysis of the same samples in the same laboratory using prescribed conditions — but performed by different analysts using different instruments on different days. Table 4 reports on such analysis of a drug product using both the Solo VPE system and a fixed-pathlength instrument. Each data set was generated by a different analyst using a different instrument on different days.
Our results illustrate the comparatively low level of variance associated with changes in instrument, analyst, and day of analysis on the Solo VPE system. Much variance associated with results obtained from the standard UV-vis are probably related to the required performance of dilutions. In fact, because dilutions are not made when using the Solo VPE system, assessment of analyst-to-analyst variability during routine method validation is no longer meaningful.
Robustness: An analytical procedure’s robustness expresses its capacity to remain unaffected by small but deliberate variations in method parameters to provide an indication of its reliability during normal use. No direct robustness-related comparisons could be made between analyses performed on the Solo VPE system and a standard UV-vis instrument. Variance of parameters associated with analysis of a sample using a standard UV-vis system — such as sample volume used for dilution, type of pipettor, size of pipettor tip, method of mixing, and so on — are not applicable to the Solo VPE system’s method of operation. Likewise, parameters that could vary during analysis on a Solo VPE system — such as use of fibrettes (cleaned or new) and sample-vessel size — are not applicable to a standard UV-vis instrument.
However, we could get an idea of the overall robustness of the Solo VPE system by varying one of the most critical parameters on standard UV-vis systems: the sample vessel or cuvette. The type of cuvette used (and the type and quality of its materials of construction) can have a significant impact on the accuracy and comparability of results obtained with a standard UV-vis instrument. Plastic cuvettes have been available for standard UV-vis systems for several years, but their quality and batch-to-batch reproducibility have always been suspect by those considering them for use in tests that are as sensitive to variance as is protein concentration. Thus, disposable plastic 1-cm pathlength sample cuvettes have not been used in our laboratory for A280 analysis on standard UV-vis systems.
Previously, we had conducted analysis with a Solo VPE system using reusable quartz sample vessels. However, C Technologies recently made high-quality, single-use, disposable plastic sample vessels available. Use of such vessels enables further reduction in sample processing time and provides efficiency gains by removing cleaning steps required for reuse of quartz sample vessels. In most cases, the cleaning procedure entails triple rinsing with reagent-grade water followed by triple rinsing with methanol and drying by application of either a stream of purified nitrogen or a vacuum. That process typically takes between one and five minutes, depending on the type and concentration of components within a sample.
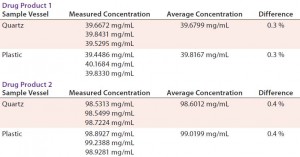
Initially, we viewed the plastic sample vessels with skepticism because of our previous experiences with plastic 1-cm cuvettes. However, as Table 5 shows, results obtained from our analysis are very close for two drug products at differing concentrations using both quartz and plastic sample vessels.
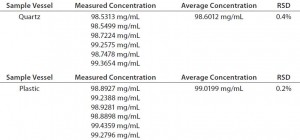
Additionally, the vessel-to-vessel variability is also comparable for quartz and plastic, as demonstrated by the %RSD results obtained from our analysis of six replicate samples. Each analysis was performed using a new (plastic) or cleaned (quartz) vessel. Table 6 presents the resulting data. Through all of those data, it has been demonstrated that the Solo VPE system is tolerant of variability in one of the most sensitive areas of traditional A280 analysis. That tolerance can directly translate into gains in efficiency and streamlining of the assay through routine use of disposable plastic sample vessels.
Discussion
In our study, we realized significant efficiency gains through the use of the Solo VPE system. Because slope-spectroscopy analysis with a variable-pathlength system requires no sample preparation or dilution, a substantial amount of time is saved without changing any other aspect of the assay. With most traditional A280 methods, samples are analyzed in triplicate to average out the variability associated with the sample preparation and dilution performed by analysts. Because it is no longer necessary to compensate for that variability, analysis of replicate sample preparations may be reduced or eliminated.
Altogether those gains provided >70% savings in instrument time for samples analyzed during our study. Up to 22 in-process A280 sample assays may be performed during a typical manufacturing run, not including bracketing standard runs. In many cases, a manufacturing facility may be waiting on those test results before proceeding to the next step in processing. The ability of our analytical laboratory to provide results with the highest level of confidence in the shortest amount of time is therefore paramount. When taking related laboratory tasks (e.g., calculations and documentation) into account, savings realized from using the Solo VPE system allowed us to reduce processing time of a typical submission consisting of three samples from two hours to 30 minutes. In most cases, documenting the analysis then became the rate-limiting step.
Additional benefits of using the Solo VPE system include confidence provided by its generated data. Sample preparation and dilution usually represent the highest single source of error in traditional UV-vis based A280 analyses. Eliminating that source of error allows an analytical laboratory to provide highly accurate data to a manufacturing facility.
As drug compounds continue to be developed with greater and greater potency, concentration of the active ingredients needed in the final products becomes significantly lower. However the acceptance ranges used for testing remain the same: frequently ±5% from the target value. Cumulative error associated with an assay — instrumental and analyst-related combined — may end up being very close to that 5%. Removing a major source of error therefore is significant to decreasing the chances of false failure. Manual calculations represent an additional possible source of analyst-related error, which the use of the Solo VPE system also eliminates.
An Alternative Approach
We have demonstrated through intensive testing that the Solo VPE system represents a quantum leap forward in laboratory capability for analysis of total protein concentration. Fundamentally this system adheres to the approach outlined by the involving analysis of protein-containing solutions using a UV-vis spectrophotometer and absorbance of light within the USP target proteins at 280 nm (8). Performance of the Solo VPE system has been demonstrated to be equal or superior to the established methodology of a standard UV-vis spectrophotometer operating on a fixed pathlength.
Data presented herein demonstrate acceptable levels of accuracy, linearity, precision, and robustness achieved using the Solo VPE system with protein-containing materials. Our data demonstrate that the system can analyze samples across a broad range of target concentrations, without the need for time-consuming, labor-intensive, error-prone dilutions. Those represent the largest limitations of traditional UV-vis A280 assays, both in terms of efficiency/throughput and confidence in results. This is, in our opinion, the single greatest strength of the Solo VPE system.
References
1 Shih E, Salerno M. The Power of Slope Spectroscopy. C Technologies, Inc.: Bridgewater, NJ, 2008; www.solovpe.com.
2 Flowers PA, Callender S. Variable Path Length Transmittance Cell for Ultraviolet, Visible, and Infrared Spectroscopy and Spectroelectrochemistry. Analyt. Chem. 68(1) 1996: 199–202.
3 Publication Number DOC0021(EN): Solo VPE System Specifications. C Technologies Inc., Bridgewater, NJ, 2011.
4 ICH Q2(R1): Guideline on Validation of Analytical Procedures. US Fed. Reg. 62(96) 1997: 27463–27467; www.ich.org/fileadmin/Public_Web_Site/ICH_Products/Guidelines/Quality/Q2_R1/Step4/Q2_R1__Guideline.pdf.
5 Chapter <1010> Analytical Data: Interpretation and Treatment. USP29–NF24. US Pharmacopeial Convention, Inc.: Rockville, MD, 2004.
6 Chapter <1033> Biological Assay Validation. USP35–NF30. US Pharmacopeial Convention, Inc.: Rockville, MD, 2012.
7 Thakkar SV, et al. An Application of Ultraviolet Spectroscopy to Study Interactions in Proteins Solutions at High Concentrations. J. Pharma. Sci. 101(9) 2012: 3051–3061.
8 Chapter <1057> Biotechnology-Derived Articles: Total Protein Assay (Method 1). USP31–NF26. US Pharmacopeial Convention, Inc.: Rockville, MD, 2006.
Scott Huffman (scott.huffman@bms.com) is a research scientist, and Keyur Soni (keyur.soni@bms.com) is an associate research scientist at Bristol-Myers Squibb, New Brunswick, NJ 08903. Joe Ferraiolo is a senior product specialist at C Technologies Inc., Bridgewater, NJ 08807; jferraiolo@ctechnologiesinc.com.

