Host-cell proteins (HCPs) are bioprocess-related impurities that may be present in intermediate or final biopharmaceutical products such as recombinant monoclonal antibodies (MAbs). Although the potential clinical and genetic effects of HCPs are largely unknown, studies have shown that HCPs may cause immune responses and adverse reactions in patients when present at sufficient high levels (1,2,3). Consequently, US Food and Drug Administration (FDA) and European Commission regulations require that the level of HCP in a bioproduct be quantitatively measured during manufacturing and before approval for therapeutic use (1, 2). The safe level of residual HCP is suggested as <100 parts per million (ppm) or below detectable levels using a highly sensitive analytical method (1,2,3,4). For such reasons, detection and evaluation of HCPs are critical parameters for the development of robust and consistent bioprocesses for protein-based biologics.
PRODUCT FOCUS: PROTEINS, ANTIBODIES
PROCESS FOCUS: DOWNSTREAM PROCESSING
WHO SHOULD READ: PROCESS DEVELOPMENT, QA/QC
KEYWORDS: IMPURITIES, HCP, IMMUNOASSAY
LEVEL: INTERMEDIATE
Detection and quantification of HCPs pose a great challenge to biopharmaceutical quality assurance/quality control. The vast molecular divergence and complexity of HCPs make it very difficult to establish accurate and specific detection methods. Extremely low levels of HCP may be present, especially at later bioprocess steps and in final bioproducts. So detecting nanograms of HCP in milligrams of drug substances requires use of highly sensitive methods. Currently, the most common techniques for HCP detection and quantification are immunoassays, such as enzyme-linked immunosorbent assay (ELISA), Western blotting, and mass spectrometry.
Proximity ligation assay (PLA) is an immunoassay for protein detection and quantification with high specificity and sensitivity (5, 6). PLA combines antibody–protein binding with detection of the reporter nucleic acid using real-time quantitative PCR (qPCR). In PLA, target protein molecules are recognized by two specific antibodies that are conjugated with oligonucleotide proximity probes (prox probes). The ends of the prox probes are brought into proximity and then joined by ligase in the presence of a connector oligo that hybridizes the ends of the prox probes. The ligation products are amplified using qPCR, and the quantity of protein targets is determined based on a standard curve. Researchers have implemented the PLA technique in a wide variety of applications, including visualizing proteins in situ, detecting infectious agents, and analyzing protein–DNA interactions (7,8,9). In 2010, Darmanis et al. described the development of solid-phase PLA by immobilizing the polyclonal antibodies onto streptavidin-coupled Dynabead magnetic beads (Life Technologies) for detecting rare protein markers in plasma (10).
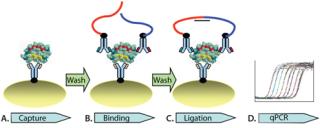
Here, we report an independent development of automated solid-phasePLA for CHO HCP detection in complex biological matrices. Solid- phase PLA is developed based on the use of magnetic streptavidin-coupled beads. The automated process is enabled on a magnetic particle processor. As Figure 1 illustrates, the automated process consists of capturing protein targets onto antibody-conjugated beads (Figure 1A). This is followed by two wash steps to remove unbound molecules, binding of the prox probes to protein targets on the beads (Figure 1B), two washes, and ligation of the prox probes (Figure 1C). The ligation mixture is then analyzed using qPCR (Figure 1D). We demonstrated that solid-phase PLA is a new platform for robust and sensitive detection and quantification of HCP. Moreover, the technology has several advantages, including a very low limit of detection, a broad dynamic detection range, and high reproducibility and robustness.
CHO HCP antigen concentrate 3G (catalog number F553H, 20 µg/mL) and the affinity-purified goat anti-CHO HCP polyclonal antibody (catalog number 3G-0016-AF) were purchased from Cygnus Technologies. The CHO HCP 3G antigen was derived from conditioned cell culture media. The CHO HCP antibody was raised using the CHO HCP 3G as the antigen for immunization and affinity purification.
Biotinylation of the Antibody: The antibody was labeled with biotin using Biotin-XX microscale protein labeling kit (Molecular Probes). Free biotins were removed using extensive dialysis at 4 °C in PBS at pH 7.4.
Antibody–Bead Conjugation: The biotinylated antibodies were conjugated to Dynabeads MyOne streptavidin T1 beads. Beads from 100 µL of the slurry were incubated with the biotinylated antibody at 100 nM at room temperature for one hour with gentle rotation. After the beads were washed twice with PBS, pH 7.4, 0.05% Tween 20 (PBST), they were resuspended and stored at 4 °C in PLA binding buffer. That buffer contains 50% assay probe dilution buffer and 50% lysate dilution buffer from TaqMan protein assays buffer kit (Life Technologies) and 0.1% Tween 20.
Antibody–Prox Probe Conjugation: To prepare the prox probes, the biotinylated antibody and the strepavidin-conjugated prox probes (5′ and 3′ prox probes) were diluted in antibody dilution buffer from TaqMan protein assays buffer kit. The biotinylated antibody at 400 nM was incubated with 5′ prox probe or 3′ prox probe (each at 200 nM) at room temperature for one hour. The conjugates were diluted 10-fold in prox probe storage buffer.
Automated Solid-Phase PLA (spPLA): The assay was performed on a MagMAX Express-96 magnetic particle processor (Thermo Scientific) in 96-well microplates. A 50 µL of sample containing HCP was incubated for one hour in sample plate with 5 µL of the magnetic beads that are conjugated with biotinylated polyclonal antibodies. The beads were collected and then transferred to wash plates. After washing twice in 100 µL of PBST for 40 seconds, the beads were transferred to 50 µL of PLA binding buffer that contained the prox probes in binding plate and incubated for one hour.
The beads were washed twice again in PBST and then transferred to 50 µL of ligation solution in the ligation plate. After a 20-minute incubation, 15 µL of the bead suspension in the ligation mixture was transferred and mixed with 15 µL of TaqMan protein PCR assay mix. Real-time qPCR was carried out on a Fast PCR instrument (Life Technologies). All incubations occurred at room temperature with gentle mixing.
Data Analysis: The quantity of CHO HCP was analyzed from cycle threshold (Ct) values of qPCR. Ct is defined as the number of cycles required for a fluorescent signal to cross the threshold. For a standard curve, Ct values were plotted against CHO HCP concentrations in a semi-log plot. To quantify the CHO HCP in samples, the nonlinear
regression model of GraphPad was applied for the standard curve, and the HCP quantity was calculated based on the standard curve.
Biologic Samples: Surrogate matrix M1 (0.8 M NaCl, 20 mM NaPO4, pH 7.5, and 10 mg/mL human IgG) contains a high concentration of salt, representing the intermediate process samples eluted from ion-exchange columns. Surrogate matrix M4 (3% mannitol, 2% sucrose, 0.01% Tween 20, 10 mM l-arginine, and 100 mg/mL human IgG) contains a high concentration of IgG, representing the final drug substance.
Results and DiscussionDevelopment and Optimization of spPLA for CHO HCP Detection: We performed several design of experiments (DoE) and defined themain effectors for optimization of spPLA performance. Particularly, concentrations of the HCP antibody in conjugation with the prox probes or with the capture beads were critical to assay sensitivity. For single protein PLA, concentrations of the antibody for capture beads conjugation and prox probes conjugation are usually 100 nM and 200 nM, respectively (4). We found that for CHO HCP detection, the sensitivity of the spPLA can be significantly increased by increasing antibody concentrations in the prox probes conjugation.
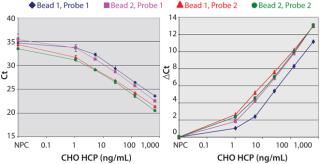
Figure 2A shows that the prox probes with 400 nM of the antibody (Probe-2) resulted in a significant reduction of the slope in the shoulder region of the curve compared to the prox probes prepared with 200 nM of the antibody (Probe-1). Thus, the assay sensitivity at low HCP concentrations was increased with Probe-2. By contrast, the capture beads that were conjugated with 100 or 200 nM of the antibody showed similar assay sensitivity (Figure 2A).
Because the Ct values of the nonprotein control (NPC) varied at different assay conditions, we compared the ΔCt values between the NPC and each of the dose points (Figure 2B). Among all of the assay conditions, the combination of Probe-2 and Bead-1 showed the highest ΔCt at most dose points (Figure 2B). So we implemented the assay condition (400 nM or 100 nM of the antibody for the prox probe conjugation or for the capture beads conjugation, respectively) in all subsequent tests reported herein.
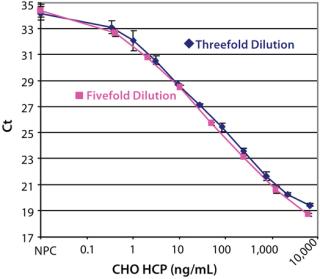
After optimizing the assay, we achieved an estimated detection limit (DL) of 0.25 ng/mL, based on the Ct signal-to-NPC values using the approach described in ICH Q2 R1. Figure 3 shows typical CHO HCP dose-response curves from different spPLA experiments. An important feature of the CHO HCP dose-response curve is the broad dynamic range with over four orders of magnitude. The linear range in the curves is also more than three orders of magnitudes, from 1 to 2,000 ng of CHO HCP/mL (Figure 3). In our spPLA tests, we use the dose-response curve with fivefold dilution of purified CHO HCP as the standard curve for CHO HCP quantification.’
Sensitivity of spPLA depends on the affinity, sensitivity, and specificity of the antibody; reduced noise or background; and number of antibody-protein targets in a reaction. For each of the protein targets, a minimum of three specific antibodies are required for HCP detection with spPLA that recognize three epitopes of one particular protein. By comparison, a sandwich ELISA requires two epitopes. The requirement for recognition of three epitopes in spPLA can serve to further enhance the detection specificity by eliminating background signals due to nonspecific binding or cross-reactivity of some antibodies.
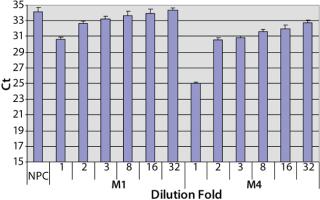
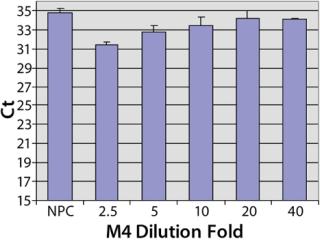
Sample Preparation to Reduce the Matrix Interference: To investigate the assay performance of the automated spPLA in complex biological substances, we spiked CHO HCP 3G into the surrogate matrices and determined the HCP quantities using automated spPLA. During the development of the automated spPLA, we observed that the matrices containing no CHO HCP displayed signals for the HCP. The Ct values in the undiluted (onefold) matrices without HCP were lower than that of NPC, which can give false signals for the HCP (Figure 4). This phenomenon was more significant in M4 (Figure 4). The false HCP signals could be reduced by preincubation of the matrices with protein A agarose or by blocking with the antihuman IgG antibody, suggesting that the interference is due to nonspecificbinding between the human IgG and CHO HCP antibodies (data not shown).
A simple way to reduce the matrix interference is by diluting the matrix before the assay. As shown in Figure 4, the false HCP signals decreased as the Ct values increased with the increase of the dilution in PLA binding buffer. At eightfold dilution, the Ct value of M1 reached to the level of NPC, indicating that the interference in M1 was minimized by diluting out of the IgG in the matrix. The false HCP signals in M4 were much higher than those in M1 and could not be eliminated at up to 32-fold dilution in PLA binding buffer (Figure 4). We then tested a blocking buffer by supplementing 5% dry milk in PLA binding buffer (provided by our colleague Mark Shannon). The blocking buffer effectively reduced the interference in M4, and the effect was maximized at 20-fold dilution (Figure 5).
Quantificatio
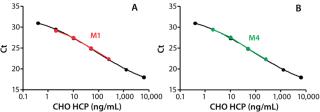
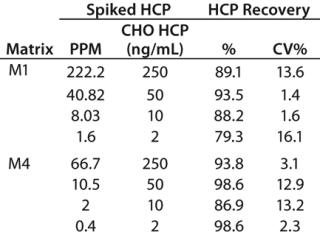
n of CHO HCP in Surrogate Matrices: We spiked CHO HCP 3G into matrices M1 and M4 at various concentrations and analyzed the HCP using the automated spPLA. Before those tests, M1 samples containing the HCP were diluted eightfold in PLA binding buffer, and M4 samples containing the HCP were diluted 20-fold in the blocking buffer. We calculated HCP quantities using GraphPad Prism 5 software based on the CHO HCP standard curve. Figure 6 shows the HCP quantities in M1 and M4 determined using spPLA and their comparisons with the standard curves.The HCP quantities almost overlapped with the standard curves, indicating that the quantities determined using spPLA were very close to the HCP spiked (Figure 6). HCP recoveries at different HCP concentrations were ∼80% or higher (Table 1). We also achieved high HCP recovery levels at <10 ppm of CHO HCP concentrations in both M1 and M4 (Table 1). Those results demonstrated excellent performance of the automated spPLA for CHO HCP quantification in complex biological samples.
Table 1: Recovery of CHO HCP with the automated spPLA
Automated spPLA provides a robust and highly sensitive analytical method for HCP detection and quantification. The dynamic range of spPLA is as broad as four orders of magnitude — much greater than that of ELISA, which is typically one to two orders of magnitude. Furthermore, the spPLA method demonstrated excellent performance with various biological substances, producing consistent and accurate measurements and high recovery rates for HCP. We believe that implementation of automated spPLA can greatly benefit and improve HCP evaluation.
Author Details
Corresponding author Nan Liu is a staff scientist, Maxim Brevnov is a principal scientist, Manohar Furtado is head of R&D, and Jenkuei Liu is senior staff scientist, all at Pharma Analytics Group, Bioproduction Division, Life Technologies, 850 Lincoln Drive Centre, Foster City, CA 94404;

