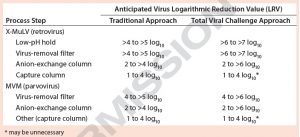
Table 1: Traditional viral clearance (VC) execution (percent virus spiking without large-volume testing) compared with total viral challenge (including large-volume testing) — anticipated VC results
Biologics derived from mammalian organisms have been accepted for therapeutic use for almost a century (1). However, these pharmaceuticals have the potential for contamination with pathogenic adventitious agents such as viruses. With cell-line–derived recombinant proteins, the viral risks commonly include viruses in the Retroviridae and Parvoviridae families (2). As patient safety and manufacturing facility suitability became significant concerns in the 1980s and 1990s, several industry and regulatory bodies reached consensus on how to approach the unique challenges of viral safety in biotherapeutics (3–5).
The resulting “safety tripod” brings together three principles in a systematic approach that provides both patient safety and risk mitigation in the manufacturing of biotherapeutics. First, a risk assessment for viral contaminants is conducted that builds strategies to reduce or eliminate risks through selection and sourcing of raw materials or implementation of testing strategies. Second, testing of raw materials (including cell banks) and in-process samples is implemented to identify virus contamination events before batch release.
Third — and arguably the most important for production of biotherapeutic proteins — viral clearance processes (validated virus reduction or inactivation) are introduced to downstream manufacturing for clearance of a wide-ranging panel of relevant and/or model viruses (5). Sourcing of cell banks and raw materials and quality control (QC) tests have limits and sometimes fail to detect all adventitious agents, which has resulted in a number of virus contamination events over the years (6–8). Viral clearance provides a consistent and robust level of protection for both patients and biomanufacturing facilities when combined with appropriate validation and manufacturing plans.
Typical viral clearance strategies include validation of virus inactivation through low-pH or solvent/detergent holds and virus reduction through chromatography steps as well as virus-retentive filtration. Multiple approaches can satisfy the requirement to use orthogonal clearance steps in a given process (4, 5). Low-pH holds, solvent/detergent treatments, and chromatography steps depend on specific chemical properties of viruses and can prove difficult to implement for good clearance of small nonenveloped viruses (9). Nanofiltration provides a well-characterized size-exclusion mechanism for retention of all but the smallest viruses, regardless of their chemical attributes (10). So it is a highly robust viral clearance step that provides a logarithmic reduction value (LRV) >4 for even difficult-to-clear small (18–24 nm) nonenveloped parvoviruses under a broad range of process and operating conditions (11).
Traditionally, virus-retentive filtration unit operations have been validated by conducting laboratory-scale spiking studies. Testing of small-scale filtration processes uses a virus-spiked feed solution prepared as a function of spike percentage of total volume (5). That methodology historically has provided sufficient results for virus stocks produced with typical purification strategies (nonspecific or nonoptimized methods). However, percentage spiking with more highly purified, higher titer virus stocks could yield improved viral clearance results but also may produce inconsistent and unacceptable viral clearance results that can affect critical study filing dates (12).
Here, we explore the advantages of implementing a total viral challenge approach in conjunction with large-volume testing over the traditional percentage-spiking method without large-volume testing (Table 1). In our virus-removal filtration studies, we used protein solutions spiked with ultrapurified minute virus of mice (MVM, 18–24 nm) or xenotropic murine leukemia virus (X-MuLV, 80–130 nm). It is important to note that extra-volume sample testing can have a significant impact on claimable LRVs in cases of complete or near-complete clearance. The resulting data in Table 1 show that with modern approaches to spiking methodologies, expected LRVs have increased significantly across separate and distinct unit operations. That potentially allows for fewer process steps to be evaluated in viral clearance studies.
Materials and Methods
Selection of Virus-Removal Filters: The two virus-retentive filters we selected for this study (both from Asahi Kasei Medical Co., Inc.) clear parvoviruses and are made of two different membrane materials. Whereas the Planova 20N filter is made of a regenerated cellulose hollow fiber, the Planova BioEX filter is made of a modified (hydrophilized) polyvinylidene fluoride (PVDF) membrane.
Advanced Database: To gain valuable insights into the specific unit operations of individual viral clearance studies, we consulted a comprehensive database with entries from more than 3,500 studies spanning over 25 years (WuXi AppTec). For this study, we reviewed records with the following criteria:
- parvovirus-grade virus-retentive filters
- virus spikes of ultrapurified MVM or X-MuLV
- operating parameters (e.g., load concentration, volume, throughput, and
pressure) made available to account for atypical products and processes.
We included study results covering a broad range of virus LRVs. From this extensive array of data, we could make recommendations for spiking and testing requirements to produce optimal filtration performance and the potential for high viral clearance (14).
Selection of Virus Stocks: In this study, we used both X-MuLV and MVM because they are widely accepted model viruses in viral clearance studies for biotherapeutics. MVM is a relevant small (18–24 nm) nonenveloped virus that has caused a number of documented bioreactor contaminations; X-MuLV is considered to be a model virus for many processes because certain cell lines have been shown to have endogenous retroviral-like particles (15). For this study, we used ultrapurified virus stocks of both types.
To generate such virus preparations, chromatographic techniques are used as the main purification method, with an additional proprietary purification step included in preparation of ultrapurified MVM virus stocks. QC analysis of the ultrapurified viruses reveals that both stock preparations contain fewer contaminants than other grades of purified virus and consist of mostly monodispersed forms of viruses of known size for each virus type (16, 17).
Using ultrapurified virus stocks ultimately enables testing with lower spiking volumes and minimally affects virus-removal filter performance while yielding high viral-clearance values of 5–6 log10 or more (16, 17). Modern parvovirus preparations are roughly 0.5–1.0 log10 (plaque forming units, PFU) different from their historical counterparts, a difference that can represent a three- to 10-fold increase in infectious particles and thus should be taken into account when spiking parvoviruses into sample load materials.
Study Design and Execution: In this study we conducted 16 filtration runs: eight using Planova 20N filters and eight using Planova BioEX filters. For each filter type, we tested high and low operating pressures with MVM (duplicate runs), X-MuLV (single runs), and without virus (a single mock run). The high and low filtration operating pressures were
- 14 psi and 10 psi, respectively, for Planova 20N filters
- 45 psi and 30 psi, respectively for Planova BioEX filters.
First, we thawed the feed material (human IgG from Equitech-Bio), diluted it to 0.1 g/L in 10-mM sodium phosphate and 40-mM sodium chloride buffer (pH 7, 6.4 mS/cm), and stored it at 2–8 °C. Before filtration, MVM or X-MuLV stocks were spiked into room-temperature protein solution at a target total challenge of 7.5 log10 PFU/filter based on our review of previous study results from the viral clearance database. We processed spiked load material through a 0.2-µm prefilter (MVM-spiked solution) and 0.45-µm prefilter (X-MuLV–spiked solution). Load and processing controls were removed from the spiked material for each run.
For all run conditions, we applied the feed material in the same manner to each filter and collected filtrate in two 100-L/m2 fractions followed by a 10-minute complete system depressurization, then collected a single 15-L/m2 buffer flush at the initial operating pressure in a separate fraction. Each fraction was assayed separately. Additionally, we created a representative pool with proportional amounts of each of the three fractions for large-volume analysis. To determine volumetric throughput and flux of each filtration run by mass, we used Asahi Kasei Bioprocess data-acquisition software.
Virus Titer Quantification: We used standard plaque-assay methodologies for determining virus titer of both MVM and X-MuLV. Rapid large-volume testing was conducted on simulated pool samples for reducing the assay limit of detection (LoD) and increase reported virus LRV for samples in which no virus was detected.
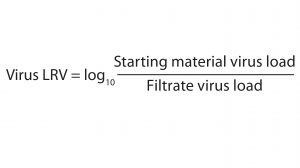
Briefly, the plaque assays involved producing a monolayer growth of either 324K cells (for MVM) or PG4 cells (for X-MuLV) in six-well plates or large-volume dishes. We incubated the cell monolayers with run sample dilutions at 37 °C — one hour for MVM samples and two hours for X-MuLV samples. After removing the samples from the plates and dishes, we overlaid the cell monolayers with an agarose/culture media mixture and incubated them at 37 °C for either six days (X-MuLV) or 10 days (MVM). Following that final sample incubation, we fixed each cell monolayer with a formalin solution and stained it with crystal violet. Plaques (voids in the cell monolayer) were counted and converted into a plaque-forming unit per milliliter (PFU/mL) measurement for each sample. We calculated virus LRV using Equation 1.
Results and Discussion
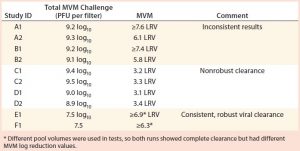
Database Findings: Analysis of data obtained from the viral clearance database revealed artifacts of variable data or poorly optimized clearance (several presented in Table 2). Viral clearance was still effective for runs in studies A and B (internal data), but inconsistent breakthrough was observed and produced variation in virus LRV of more than 1 log10 between duplicate runs. In studies C and D (internal data), nonrobust viral clearance was obtained with MVM LRV <4. Cases E and F (internal data) showed the potential to achieve consistent and higher MVM LRV for studies conducted within the normal bounds of traditional process parameters.
Even though viral clearance artifacts typically are observed only in studies using the smallest parvoviruses, significant risk remains that less satisfactory results could compromise the development and regulatory approval of biopharmaceuticals substantially. Thus, recommendations for using optimized virus preparations in virus-filtration studies have been made (14). Note that a correlation was observed between lower spiking challenges and more consistent viral clearance results, suggesting that virus load may be a critical factor in ensuring predictable outcomes (Table 2). Limiting the total viral challenge to 7.5 log10 PFU/run could mitigate the risk of such artifacts in viral clearance studies, as observed in studies E1 and F1.
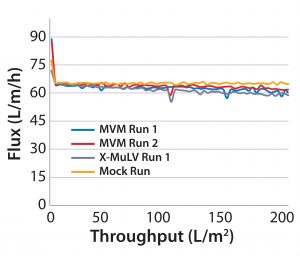
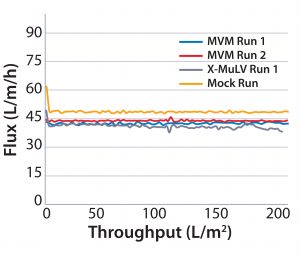
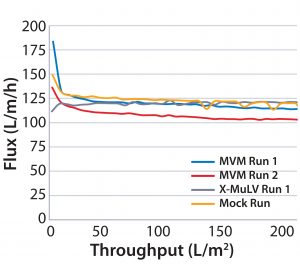
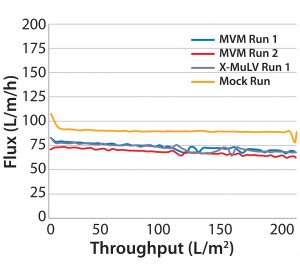
Process Flux: All filtrations were executed successfully and demonstrated minimal impact of virus spikes on process performance (Figure 1–4). For high-pressure runs with both filter types, spiked runs and mock runs had equivalent starting flux and experienced little to no flux decay, indicating that the virus spike did not affect filter performance. For low-pressure runs with both filter types, the spiked runs had lower starting flux than the mock runs but did maintain similarly near-zero flux decay by comparison. Although we did observe differences in initial flux, the filters performed adequately throughout all runs, with all target filter throughputs achieved.
Viral Clearance: Table 3 reports viral clearance data for MVM runs, and Table 4 shows X-MuLV results. No virus was detected in any filtrate sample during this study, and there was no measurable impact of low pressure or process pause on the filters’ viral clearance capability. For all runs conducted with the total viral challenge approach, the simulated pool showed complete clearance with a virus LRV ≥5.9, demonstrating the benefits of this approach. Our dataset strongly supports the use of the total viral challenge approach in conjunction with large-volume testing for viral clearance studies: No viral breakthrough was observed, and consistent robust viral clearance was achieved for all tests.
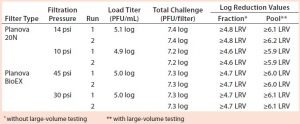
Table 3: Viral clearance data resulting from filtrations spiked with minute virus of mice (MVM); “≥” indicates complete clearance
To provide context for setting virus-spiking levels, considering virus titers that could arise during a contamination event is important to ensuring that the virus challenge presented during validation studies provides a relevant or worst-case scenario. In recombinant bioprocesses, contaminants usually are identified first in a bioreactor because of their deleterious impacts on cell culture performance. Even when they are not detected at such an early stage, broad in vitro testing or contaminant-specific molecular testing of unprocessed bulk materials usually have LoDs ≤1 log10 PFU/mL (18).

Table 4: Viral clearance data from filtrations spiked with xenotropic murine leukemia virus (X-MuLV); “≥” indicates complete clearance
Therefore, a gross contamination event is likely to be detected. However, in the unlikely case that virus contamination had no observable impact in a bioreactor and was not detected with bulk testing procedures, other virus-removal steps (column chromatography and/or chemical inactivation) before virus filtration certainly would reduce the contaminating virus load.
A Virus-Filtration Example: The only published report of parvovirus titer from a bioreactor contamination indicated a MVM titer of 6 log10 copies/mL by quantitative polymerase chain reaction (qPCR) (8). In this case, the contaminant was discovered through MVM-specific testing. Regardless, the manufacturing process probably would include chromatography steps that could be expected to reduce that level by 2–6 log10, resulting in a worst-case MVM titer of 4 log10 copies/mL at the virus-filtration step. Spiking virus at around 5 log10 PFU/mL thus still provides a greater challenge than the worst-case level for that step.
Understanding relevant viral challenge situations during plasma-product manufacturing is complicated by variations in potential viral clearance steps used for different products and different virus classes. However, it is helpful to note that robust molecular testing regimes are used to limit potential virus loads in plasma pools. For instance, the US Food and Drug Administration (FDA) has provided guidance that B19 parvovirus levels should be <4 log10 copies/mL (19). Without any additional virus-removal steps, a 5 log10 PFU/mL parvovirus spike still represents a worst-case scenario for removal of that contaminant.
In our study, we attempted to reproduce that viral load titer. In so doing, we believe we have reduced the likelihood of observing aberrant viral clearance study artifacts.
A Modern Approach
Our study demonstrates the benefits of using the total viral challenge approach in designing viral clearance studies. By limiting total viral challenge to 7.5 log10 PFU per virus filter, you can achieve highly robust virus LRV while minimizing the risk of study artifacts. The effect is further amplified when this technique is used in conjunction with contemporary virus preparations and large-volume sample testing. Although we have discussed the application of implementing the use of total virus challenge for virus-filtration runs, note that the same methodology has been implemented in other unit operations such as chromatography or low-pH inactivation. In future studies, investigators should consider the tools described here for guidance on achieving appropriate viral clearance as needed for their own downstream purification processes.
References
1 Lalonde R, Honig P. Clinical Pharmacology in the Era of Biotherapeutics. Clin. Pharmacol. Ther. 84, 2008: 533–536.
2 Stuckey J, et al. A Novel Approach to Achieving Modular Retrovirus Clearance for a Parvovirus Filter. Biotechnol. Prog. 30(1) 2014: 79–85; doi:10.1002/btpr.1820.
3 Sofer G, et al. PDA Technical Report No. 41: Virus Filtration. PDA J. Pharm. Sci. Technol. 59(S-2) 2005: 1–42.
4 CPMP BWP 268/95. Note for Guidance on Virus Validation Studies: The Design, Contribution and Interpretation of Studies Validating the Inactivation and Removal of Viruses. European Medicines Agency: London, UK, 14 February 1996.
5 ICH Q5A. Viral Safety Evaluation of Biotechnology Products Derived from Cell Lines of Human of Animal Origin. US Fed. Reg. 63(185) 1998: 51074.
6 Victoria JG, et al. Viral Nucleic Acids in Live-Attenuated Vaccines: Detection of Minority Variants and an Adventitious Virus. J. Virology 84(12) 2010: 6033–6040; doi:10.1128/JVI.02690-09.
7 Skrine J. A Biotech Production Facility Contamination Case Study — Minute Mouse Virus. PDA J. Pharm. Sci. Technol. 65(6) 2011: 599–611; doi:10.5731/pdajpst.2011.00823.
8 Moody M, et al. Mouse Minute Virus (MMV) Contamination — A Case Study: Detection, Root Cause Determination, and Corrective Actions. PDA J. Pharm. Sci. Technol. 65(6) 2011: 580–588; doi:10.5731/pdajpst.2011.00824.
9 Aranha H, Forbes S. Viral Clearance Strategies for Biopharmaceutical Safety, Part 2: A Multifaceted Approach to Process Validation. BioPharm 14(5) 2001: 43–54, 90.
10 Yamamoto A, et al. Effect of Hydrodynamic Forces on Virus Removal Capability of Planova™ Filters. AIChE J. 60(6) 2014: 2286–2297 ; doi:10.1002/aic.14392.
11 Hongo-Hirasaki T, Komuro M, Ide S. Effect of Antibody Solution Conditions on Filter Performance for Virus Removal Filter Planova™ 20N. Biotechnol. Prog. 26(4) 2010: 1080–1087; doi:10.1002/btpr.415.
12 Asher D, et al. PDA Technical Report No. 47: Preparation of Virus Spikes Used for Virus Clearance Studies. Parenteral Drug Association: Bethesda, MD, 2010.
13 Chen D, Chen Q. Virus Retentive Filtration in Biopharmaceutical Manufacturing. PDA Letters 15 April 2016: www.pda.org/pda-letter-portal/archives/full-article/virus-retentive-filtration-in-biopharmaceutical-manufacturing Accessed on 21FEB2016.
14 Hongo-Hirasaki T, et al. Effects of Varying Virus-Spiking Conditions on a VirusRemoval Filter Planova™ 20N in a Virus Validation Study of Antibody Solutions. Biotechnol. Prog. 27(1) 2011: 162–169; doi:10.1002/btpr.533.
15 Stauss DM, et al. Removal of Endogenous Retrovirus-Like Particles from CHO-Cell Derived Products Using Q Sepharose Fast Flow Chromatography. Biotechnol. Prog. 25(4) 2009: 1194–1197; doi:10.1002/btpr.249.
16 Slocum A, et al. Impact of Virus Preparation Quality on Parvovirus Filter Performance. Biotechnol. Bioeng. 110(1) 2013: 229–239; doi:10.1002/bit.24600.
17 Roush D, et al. Limits in Virus Filtration Capability? Impact of Virus Quality and Spike Level on Virus Removal with Xenotropic Murine Leukemia Virus. Biotechnol. Prog. 31(1) 2015:135–144; doi:10.1002/btpr.2020.
18 Gombold J, et al. Systematic Evaluation of In Vitro and In Vivo Adventitious Virus Assays for the Detection of Viral Contamination of Cell Banks and Biological Products. Vaccine 32(24) 2014: 2916–2926; doi:10.1016/j.vaccine.2014.02.021.
19 US Food and Drug Administration. Guidance for Industry: Nucleic Acid Testing (NAT) to Reduce the Possible Risk of Human Parvovirus B19 Transmission by Plasma-Derived Products. US Fed. Reg. 74(143) 2009: 37231–37232.
20 Lute S, et al. Phage Passage After Extended Processing in Small Virus Retentive Filters. Biotechnol. Appl. Biochem. 47(Part 3) 2007: 141–151; doi:10.1042/BA20060254.
Corresponding author Michael Burnham is a senior principal scientist in process development and commercialization, Alexander Schwartz is a viral clearance scientist, and Joseph Hughes is vice president of biologics testing at WuXi AppTec, Inc., 4751 League Island Boulevard, Philadelphia, PA 19112; 1-215-218-7100 x5542; mike. burnham@wuxiapptec.com. Esha Vyas is field applications manager, Nanna Takahashi is an account manager, Pauline Nemitz was field applications manager (now with Sartorius Stedim Biotech), Daniel Strauss is a principal scientist, and Naokatsu Hirotomi is executive vice president and general manager of Asahi Kasei Bioprocess America, Inc., 1855 Elmdale Avenue, Glenview, IL 60026.

