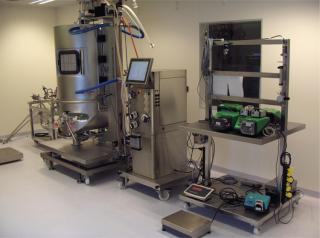
Contract manufacturer DSM Biologics — at its current good manufacturing practices (CGMP) facility in Groningen, The Netherlands — provides services for clinical development and commercial production based on mammalian cell culture technology (Photo 1). During the 2011–2012 year, the facility went through a major expansion project to enlarge its capacity and fulfill a growing customer demand. From a business point of view, the project had a well-defined target for future production capacity as well as investment volume.
Photo 1:A major part of the project focused on restructuring downstream operations to match upstream capacities. The objectives required full understanding of the annual output that is possible if the facility is extended by one or two downstream processing suites. The optimal solution would be to achieve target capacity with minimum investment. M+W Group supported DSM Biologics to find the right approach and identify the best solution.
PRODUCT FOCUS: ALL BIOLOGICALS
PROCESS FOCUS: MANUFACTURING
WHO SHOULD READ: PROCESS DEVELOPMENT AND MANUFACTURING
KEYWORDS: SIMULATION, PROCESS MODELING, FACILITY DESIGN, PRODUCTION CAPA#CITY, CELL CULTURE
LEVEL: INTERMEDIATE
The Groningen facility offers multiple production capabilities and high flexibility (Table 1), including fed-batch, perfusion, and proprietary XD technology processes (1). For each of those, the company offers production volumes from small to commercial scale. In addition, process development data have shown product titer ranges from milligrams to 20 g/L or more.
Table 1: Production technologies, bioreactor volumes, and titers at DSM Biologics; perfusion output is the sum of continuous processing over time.
The combination of different technologies, volumes, and product titers has led to multiple production processes with different production times and resource needs (e.g., equipment use and/or production suites). For example, fed-batch cell culture may take two to three weeks, whereas perfusion takes four to six weeks, and XD cell culture normally takes between 10 and 14 days. The total amount of product will affect the use of downstream equipment and production suites. DSM Biologics can run XD cell culture at 50-, 250-, and 500-L scales, with expected product titer ranges between 5 and 20 g/L. So the amount of protein to be purified will be from 250 g to 10 kg per batch. With such a large range of protein amounts, the facility can process a batch only if it is handled in cycles (once the largest piece of equipment is in use). As more protein is produced, more cycles are needed, and downstream equipment and suites are occupied for longer periods. In the worst case, downstream operation becomes a bottleneck that limits total production capacity.
Because customer demand defines the type of batches or processes, it is difficult to estimate the output number of batches per year in advance. If we assume full occupancy of the facility, the number of batches may be higher when DSM Biologics runs short, small-volume, and low-titer processes. Longer, large-volume, and high-titer processes may decrease the total number of batches processed in one year.
If the number of batches depends on the processes and customers’ demands, how can we define a production capacity to provide a clear answer to business needs? A typical approach is to look into the worst- and best-case scenarios by analyzing the different situations one by one. However, with such a large number of process options, that approach can be cumbersome. More important, it does not provide a clear satisfactory answer to the true capacity and the number of additional downstream suites that may be required.
Statistical Analysis for Process SimulationIf the number of batches differs each year, it should be logical to determine the probability of achieving target capacity. To provide a satisfactory answer, we applied statistical analysis to process simulation (2). That allowed us to build a process model and predict a production schedule by taking into account different resources. Our model included all production processes, equipment, and production areas.
The method is very simple and comprises the following steps:
-
Assume a possible production sequence for a period longer than one year (e.g., fed batch– perfusion–perfusion–XD–XD and so on).
-
Simulate the production sequence over a period of one year.
-
Then count the number of batches that have been fully processed.
-
Repeat the above steps multiple times (e.g., 500). Note that each simulation cycle represents one production year (500 years of production).
-
The number of batches achieved each time is the basis for a statistical analysis to determine the probability of achieving a certain number of batches.
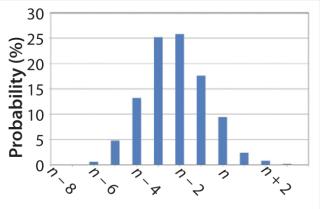
Figure 1 shows an example of the statistical analysis in which we can see the probability of achieving a certain number of batches in one year. For example, assume that the production target is n batches per year. We can see that the most likely is to achieve n – 2 or n – 3 batches each year. However, it can be as low as n – 6 but not less. We should also not expect more than n + 3 batches in one year as a best case.
On the other hand, we can also clearly define that we have a cumulative probability of 95% to reach n – 4 or more
batches. The accumulative probability is reduced to just 12% for the target of a minimum of n batches per year.
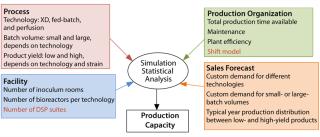
One or Two Additional Downstream Suites and Shift Model: As shown in Figure 2, production capacity of a facility depends on multiple factors that can be classified into four main groups: process, facility, production, and sales. The combination of all four determines the capacity of a facility.
Process relates to the duration of the different production processes as a result of a technology (e.g., fed-batch, XD, perfusion), with the batch scale and product titer as described above.
Facility relates to the capability of running multiple processes in parallel or in campaigns as a result of the number of equipment and production suites in the facility.
Production organization relates to the total effective production time as a result of shift model, maintenance period, and so on.
Sales forecast relates to intent of facility use based on customer demand.
In the case of DSM Biologics, our efforts focused on the number of downstream suites and on the shift model. The number of production suites relates to investment and operational cost. We assumed that in the case of operating two new downstream suites, all would be used in parallel. That would require two new operator teams (one per suite).
The shift model relates to production organization and has a direct correlation with operational cost. For all other variables, the most likely scenarios were defined or fixed. For example, sales forecasts and past records outlined the probability of occurrence of the different process technologies (e.g., fed-batch, perfusion, or XD), production scale, and titer over one year. So we could define that in a year, the majority of the batches would be fed-batch processes (e.g., 70%), whereas the remaining batches would be XD and perfusion processes. We made similar assumptions for batch volumes and expected titers.
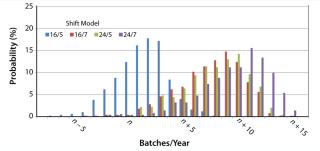
Capacity Extension Strategy: We conducted statistical analyses for different shift models for both one and two additional downstream suites (Figures 3 and 4, respectively). We obtained a well-defined statistical distribution curve for all cases.
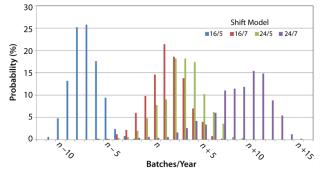
The results for two additional downstream suites (Figure 3) show that the shift model had almost no influence on capacity, except for 16/5 (16 hours a day and five days a week). So with two additional suites operating in parallel, there is enough capacity and time to process all batches transferred from upstream. In that case, upstream operation (cell culture duration) is the limiting factor in the overall capacity.
If we limit the working or processing time to a 16/5 shift, the downstream operation limits production capacity because the number of batches per year is lower. However, if the target capacity is n, then a short-shift model such as 16/5 should be sufficient for all but ~20% of the cases, for which DSM Biologics may just reach between n – 7 and n – 1 batches. Nevertheless, in other years (~68% of the cases) we may be at overcapacity or enjoy an opportunity for additional sales. For longer shift models, the use of human resources is suboptimal and doesn’t contribute to increasing overall production capacity. Additional processing time would be wasted in waiting.
Results from adding one more downstream suite (Figure 4) show a stronger influence of the shift model. The maximum and minimum capacities correspond to 24/7 and 16/5 models, respectively. Results for 16/7 and 24/5 are only slightly different because the total processing time is very similar, 112 and 120 hours/week.
Target capacity of n batches per year would not be feasible with a 16/5 shift model. For all other cases, target capacity would be reached with comfort. A 24/7 shift wouldn’t be necessary to reach target capacity. The decision to adopt a 24/5 or 16/7 shift can be made to best fit process and personnel demands.
If we compare the results for one or two additional suites, the maximum theoretical number of batches that can be accomplished without limiting processing time (24/7) is similar in both cases (n + 14 and n + 15 batches per year). In other words, there is enough downstream processing time, and the limiting factor is upstream production. However, comparing the lower capacity (16/5 shift) for one and two additional suites, results show that the lowest capacity corresponds to just one suite. So if working time is limited to a 16/5 shift, an investment is needed in an additional suite to achieve target capacity.
M+W Group’s statistical analysis facilitated DSM management to make a well-thought decision. It defined the facility extension that best fitted DSM’s business goals of reaching certain production capacities within a sound investment volume. The final decision was to build one complete new state-of-the-art downstream suite based on disposable technology. It resulted in good occupation of downstream units with a clear path to increase production capacity as a response to market demand. At the same time, the production group had a clear understanding on the role of the shift model in future processing.
Beyond the Data Sheet: Worst- and Best-Case CalculationsA calculation based on worst- and best-case scenarios would have been suboptimal for this purpose. Assuming that we could have identified those scenarios, they would correspond to the minimum and maximum values of the statistical distribution curves.
For instance, for just one additional downstream suite and a 16/7 or 24/5 shift model, the results would be n – 6 (worst case) and n + 10 (best case) batches per year. With the target capacity of n batches per year, it
would have been difficult to guaranty the output to management with any confidence. The final decision might have been to invest in one additional suite, but to operate at 24/7 or invest in two new suites and operate with a shorter shift model.
Statistical analyses applied to process simulation has been proven to be a strong tool. It allowed DSM Biologics to make a strategic decision to ensure the soundest investment and mode of operation instead of using a worst- and best-case scenario calculation.
This statistical analysis approach is not limited to capacity analysis (as in this case). It clearly can be performed for all types of situations where there is a strong variability.
Author Details
Annette Kaya is a process engineer for process design and simulation, Andrea Uebele is an engineer in process technology, Anke Seeger is head of section facility design and simulation, all at M+W Process Industries. Hans ter Maat is technology support manager, DSM Biologics BV, Zuiderweg 72/2, 9744 AP Groningen, Netherlands. Corresponding author David Estapé is technology manager, biotechnology, at the global technology service of M+W Germany GmbH, Lotterbergstrasse 30, 70499 Stuttgart, Germany; 49-711-8804-2843; fax 49-711-8804-1330;

