Two major challenges associated with optimizing biomanufacturing operations remain unresolved. The first is variability: how to understand and improve manufacturing with significant variation in process times throughout all unit operations. The second is complexity: modern biomanufacturing facilities are complex and interconnected, with piping segments, transfer panels, and valve arrays, as well as water for injection (WFI) and other shared resource constraints. That complexity is becoming even greater with the need for process standardization and processing of higher (and more variable) titers and additional products.
In such an environment, “debottlenecking” is becoming increasingly important as a means of quantitative process optimization. This technique allows biomanufacturing facilities to run new products with minimal retrofits and also increase the run rate of existing legacy products without significant regulatory impact. Debottlenecking therefore allows a biomanufacturing facility to significantly extend its useful life by making the site more flexible and efficient. When judiciously applied in the correct areas, retrofits can be an order of magnitude less expensive than building new capacity and can be performed in one year or less (compared with four to six years for building a new facility).
PRODUCT FOCUS: ALL BIOLOGICS
PROCESS FOCUS: MANUFACTURING
WHO SHOULD READ: PROCESS DEVELOPMENT, MANUFACTURING, PROJECT MANAGEMENT, AND OPERATIONS
KEYWORDS: DOWNSTREAMPROCESSING, CHROMATOGRAPHY, DATAMANAGEMENT, DESIGN OF EXPERIMENTS, VARIABILTY
LEVEL: INTERMEDIATE
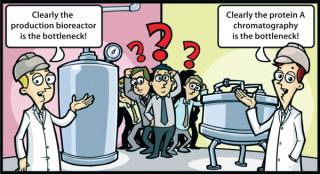
Here we discuss the impact of variability and complexity on debottlenecking and optimization. We show historical approaches to debottlenecking based on resource use and why they can lead to incorrect assessments of the real bottlenecks in biomanufacturing facilities. We look at alternatives to collecting data solely from subject matter expert (SME) opinions, which can be biased. We have observed that SMEs in biomanufacturing facilities usually have detailed knowledge about one area of a process but often find it difficult to agree on bottlenecks among multiple unit operations.
The “gold standard” for debottlenecking methodology today is based on perturbing cycle times or resources in a discrete event simulation model and observing the resulting impact on some performance indicator: e.g., cycle time, labor, or throughput. This involves collecting data from process historians (using software from Emerson Process Management, Rockwell Automation, and/or PI, for example) and performing sensitivity analysis on those cycle times. Debottlenecking is important both in resource-constrained facilities (for which increasing throughput provides a positive return on investment, RoI) and in throughput-constrained facilities (where companies seek to make the same amount of product with increased efficiency and at lower cost). In either case, debottlenecking provides a quantitative method of accurately finding the critical processes in a facility and assessing potential improvements to its overall performance.
Introduction to Debottlenecking
Debottlenecking is the process of improving efficiency by finding the rate-limiting steps in a facility and correcting them. Addressing those steps will improve performance, whereas changing other (non–rate-limiting) steps will not affect performance. A complete manufacturing system may have several hundred key activities, but only a small number of them (typically less than a dozen) define a facility’s run rate.
Consider a simple two-stage production process. In the first stage, a single bioreactor produces material before getting cleaned, steamed, and prepped for the next batch — taking 300 hours. In the second stage, a single downstream train purifies material produced by that production bioreactor over 72 hours. Each unit operation can process only one batch at a time, so the maximum “velocity” (processing rate) of batches through the first step is one every 300 hours (about 12.5 days). The downstream processing rate is 72 hours (about three days), so for the remaining 9.5 days, a purification skid will sit waiting for the bioreactor to finish. No improvement to the purification train (e.g., reducing its cycle time from 72 to 60 hours) will affect throughput or run rate because the “rate-limiting step” (bottleneck) is upstream, in production. Because of that, fixing the production step — either by adding additional equipment in parallel or decreasing the cycle time from 300 hours to some shorter time — is the only way to improve throughput.
Debottlenecking is typically a two-step process: First, identify the rate-limiting steps among the hundreds or thousands of potential resources and activities in the facility (bottleneck identification). Second, make changes to those rate-limiting steps — by either adding equipment, reducing cycle time, or some other means — to improve the process (bottleneck alleviation). Both are discussed below.
Data, Complexity, and Variability in Biomanufacturing
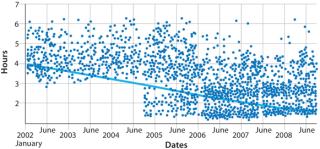
Figure 3 shows data from a biomanufacturer for clean-in-place (CIP) times from 2002 to 2008. Those data came directly from a manufacturing execution system (MES) to provide an unbiased estimate of facility performance.
(Bio-G software integrates directly with most common control systems in biotech facilities.) Note the significant variability in this process step, which takes between three and six hours. There is also process drift: The amount of time the activity takes is not constant from year to year.
The data suggest that using a single number — say, the average time —
; for planning and optimization may not identify the correct bottleneck. My experience in this area has been that running the same model with and without variability produces different bottlenecks. Such an analysis is especially of concern because finding and fixing bottlenecks can be a capital-intensive process when retrofitting a validated facility. “Fixing” the wrong area will not improve run rate no matter how much improvement is made in that particular area.
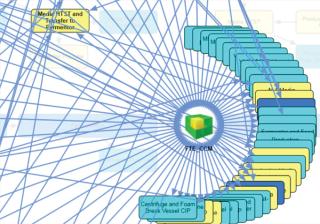
Another issue that must be overcome in debottlenecking and process optimization is process complexity. Figure 4 shows a map of the places in one facility where people interact with the process. A delay in the availability of a full-time employee (FTE) or piece of shared equipment (e.g., a CIP skid, transfer line, valve array, transfer panel, or even WFI or utility systems) will delay that process. Such “hidden” periods are not normally considered in cycle-time calculations. Complex interactions make it difficult even for highly trained operators to understand which hidden cycle times and waiting periods will slow a facility down.
Our software uses discrete event simulation and real-time data feeds to manage both variability and complexity. Discrete event simulators incorporate variability as well as constraints around how an activity can start. (So just like an automation system, an activity will not start without certain prerequisite conditions met.) This approach produces accurate models of biopharmaceutical facilities that incorporate variability and “hidden” wait times.
Bottleneck Identification
The traditional approach to identifying bottlenecks (made popular in the 1960s) focused attention on facility resources that get the most use. The theory was that such resources are “busiest” and therefore those in which improvements would have the most effect. But this approach is not guaranteed to identify the real bottlenecks in a facility. It appears from empirical evidence to be particularly ill suited to biomanufacturing facilities.
Consider as an example a facility with one large buffer preparation tank used to prepare buffer for the first two chromatography steps in downstream purification. Because the tank is used only in the first two high-volume steps of the process, its overall use is low (Figure 6). However, using that tank for two sequential chromatography steps makes the second step wait for it to be cleaned and buffer reprepped. If that process takes longer than the duration of the protein-A chromatography step, it could delay the start of the cation-exchange step. Thus, even though the tank has an overall use of 20%, it delays production and therefore represents a bottleneck.
Debottlenecking Detection
So a simplistic use-based approach to debottlenecking does not find the true process constraints in a biomanufacturing facility. The current “gold standard” is to use a simulation model to perturb (make controlled changes to) a model of the facility and observe the results according to some metric. One popular approach is to reduce operation times in each process step, one at a time, and observe their impacts on throughput. By simulating a facility in which a particular process step (e.g., CIP) takes zero time, we can examine the effect of having that activity “for free.” By repeating this experiment for every activity, we can understand the chance of reducing a potential project’s cycle time. This sensitivity analysis can correctly identify even complex bottlenecks because it makes an actual change to a system model and illustrates the effect of that change.
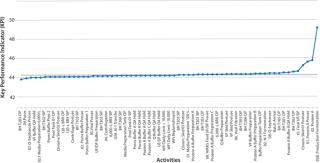
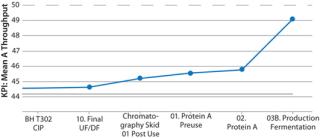
Figure 7 shows the output from just such a sensitivity analysis. In this case, the metric chosen was throughput, so a higher number indicates better performance. Each point in the graph represents reduction of a particular activity’s cycle time to zero hours and the resulting throughput observed over a 100-day campaign. The experiments are sorted with those with the most significant impacts to cycle times on the right and those with the least on the left.
As that analysis illustrates, only a small percentage of the several hundred activities in the manufacturing facility actually improve throughput. Figure 8 shows detail of the four activities that most affected throughput in the Figure 7 model (those on the far right). This approach detects bottlenecks very rapidly and is guaranteed to identify real process constraints in a system because it simulates the actual impact of a change to each constraint in turn.
Bottleneck Evaluation and Alleviation
After identifying bottlenecks, alleviating them becomes the central focus for analysis. The perturbation analysis above found that the key process constraint is the cycle time of the production bioreactor; however, the simplistic proposed change (reducing the fermentation time to 0 hours) is not a feasible engineering solution. Fortunately, it may be sufficient to improve the production bioreactor’s cycle time by a smaller amount to achieve the desired result.
To quantify how much change is needed before an activity or resource is no longer “on the critical path,” we can use a similar form of sensitivity analysis that makes changes to one or a small number of activities or resources but at a higher level of granularity. For example, we could choose to reduce a bioreactor’s set-up time by 1, 2, 3 hours and so on, then observe the impact of each on throughput or cycle time.
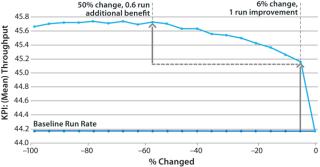
That approach provides valuable quantitative information to engineering teams because of an explicit tradeoff between key performance indicators (KPIs) at different levels of change. In Figure 9, a 6% reduction in cycle time improves throughput from 44.1 to 45.0 kg, but further reductions only increase it by a little more (0.1–0.6 kg). If 45.0 kg were sufficient throughput, then we would not pay more to further reduce the cycle time. This gives engineering teams critical information to evaluate how significant facility modifications and investments will need to be.
Iterative Debottlenecking
The approach of bottleneck detection, evaluation, and removal presented here is typically repeated iteratively to provide a series of incremental improvements for a biomanufacturing facility. As we identify and fix bottlenecks, the associated items move off the critical path, and other activities or resources become rate-limiting steps.
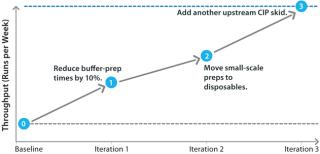
The process of incrementally debottlenecking a facility — in which we find the first bottleneck and correct it, then move on to the second and so on — produces a debottlenecking pathway. That describes the sequence of steps required to correct bottlenecks, along with KPI changes that are achieved by each step. Figure 10 outlines the results from one such analysis.
That debottlenecking pathway is a sequence of three engineering changes. Each iteration increases the run rate by a different amount. Multiple engineering changes are generally required in different areas of a facility to increase its run rate. It is important to note that the sequence order is important: In this case, moving to disposables without reducing buffer preparation times will yield no improvement. The pathway must be executed in the order shown to achieve the target run rate.
The approach outlined here can be very successful in identifying and correcting bottlenecks in biomanufacturing facilities using an iterative approach. But a design-of-experiments (DoE) approach can yield similar results and would be more suited for a highly complex facility. DoE makes multiple simultaneous changes to different aspects of a facility, and the results of those changes are monitored and analyzed.
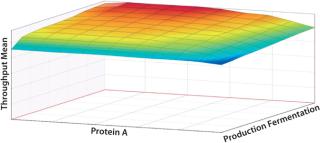
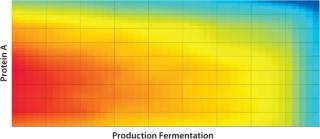
In the iterative analysis, we saw that shortening protein A and fermentation cycle times would probably have the greatest impact on improving run rates. Now how could improving those factors in combination help the company achieve its desired targets? Figures 11 and 12 illustrate the effects of simultaneously reducing the duration of both activities on the critical path. A throughput of 51 kg could come from reducing fermentation time alone by 60%. The same result also could be achieved by reducing fermentation time by just 5% if the protein A cycle time is also reduced by 10%. So the DoE approach can help you understand the tradeoffs between different possible improvements and combinations thereof, which do not simply aggregate together.
One issue with DoE is that it produces a combinatorial number of scenarios that must be examined. For example, examining two possible factors (say, fermentation time and purification time) requires four scenarios, examining three factors requires eight, four factors require 16, and so on. The advantage of this approach is that it allows for an explicit tradeoff between factors to be understood, provided that the associated modeling engine can evaluate those scenarios automatically.
The Future of Biomanufacturing Operations
Biomanufacturing facilities are asked to produce increasingly high-titer products in shorter campaigns, with a larger mix of products. The challenge in such an environment is understanding the real capacity of a facility, where its critical process constraints are, and what will improve those processes. The best-in-class biomanufacturing companies we work with understand that bottlenecks are dynamic. As a facility evolves, they move. Repeatin
g debottlenecking analyses monthly helps align manufacturing and operational excellence groups around a single goal. Manufacturing floor staff, managers, and the plant head can all focus on critical key process areas without spending time, energy, and money in areas that do not affect performance. Decision-making is based on quantitative data from models that incorporate the variability and complexity of a facility. This approach delivers continual improvements guided by factual observation rather than SME opinion. Biomanufacturing facilities that implement debottlenecking and process optimization using methodologies described herein will consistently out-perform those using more traditional approaches.
Author Details
Rick Johnston, PhD, is principal at Bioproduction Group Inc., 1250 Addison Street, Suite 107 Berkeley, CA 94702; 1-510-704-1803; rick@bio-g.com, www.bio-g.com.

