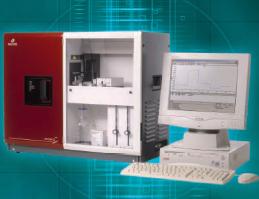
Fast, precise, and accurate quantification technologies are indispensable for efficient process development in applications such as IgG production in a GXP environment. Based on surface plasmon resonance (SPR) technology, the Biacore C system from GE Healthcare (www.biacore.com) is an alternative technology for IgG quantification that has benefits over traditional methods. Assay development is simplified and accelerated due to real-time detection. Assay hands-on time is reduced, and sample throughput can be increased using automation and efficient data evaluation with regulatory-compliant software. We developed a generic platform for hIgG quantification using the Biacore C instrument.
Immobilization of Mouse Anti-hIgG: Mouse anti-hIgG (antihuman Fc) was covalently bound as a ligand by means of primary amino groups on the carboxy-methylated dextran molecules of a sensorchip surface. We performed all our measurements using research-grade Biacore CM5 chips. Mouse anti-hIgG was immobilized using amino coupling chemistry and 10 mM acetate buffers at different pH conditions.
PRODUCT FOCUS: IGG
Concentration Measurement: We selected the “concentration analysis wizard” from the Biacore software to perform our concentration analysis, enabling optimal settings. Samples and standards were injected at a flow rate of 40 µL/min and a contact time of 120 seconds over the immobilized flow cell. For data evaluation, we calculated the signal differences (shown as resonance units) by setting report points 10 seconds before starting the injection of analyte or standard and 30 seconds after the initial injection.
After each signal generation, the sensorchip was regenerated to dissociate the analyte–ligand binding and to allow a new analyte injection. Both the response to analyte injection and regeneration were displayed in one sensorgram. To evaluate the working range of the assay, we performed a preliminary standard curve comprising a range of concentrations of hIgG4 (Ab2) and evaluated the curve using a four-parameter equation. Comparison with the standard curve allowed quantification of unknown hIgG in samples.
We examined the accuracy of this analytical method through quantification of five different cell culture samples by comparing their data with the results of a validated protein A-HPLC assay and the results of a commercially available IgGELISA from Bethyl Laboratories (catalog number E80-104, www.bethyl.com). To check the precision of our assay, we quantified one cell culture sample containing hIgG4 in four different dilutions covering the whole working range. The test was performed on five different days using five different flow cells to determine the assay’s intermediate precision.
ABBREVIATIONS
Ab: antibody
CV: coefficient of variation
EDC: 1-ethyl-3(3-dimethylaminopropyl) carbodiimide
ELISA: enzyme-linked immunosorbent assay
hIgG: human immunoglobulin G
HPLC: high-performance liquid chromatography
ICH: International Conference on Harmonisation of Technical Requirements for Registration of Pharmaceuticals for Human Use
LOD: limit of detection
LOQ: limit of quantitation
NHS: N-hydroxysuccinimid
PBS: phosphate buffered saline
RU: resonance units
SPR: surface plasmon resonance
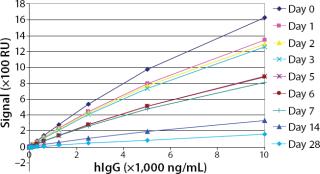
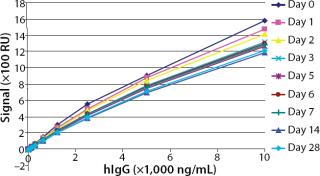
To test the robustness of our assay with regard to storage conditions, we immobilized the ligand (mouse anti-hIgG) on flow cells of two different sensorchips. One sensorchip was stored under dry conditions in a blue-cap vial at 2–8°C, whereas the other was stored in a blue-cap vial filled with Biacore running buffer HBS-EP at 2–8°C. Over one month, we performed several standard curves and compared their responses.
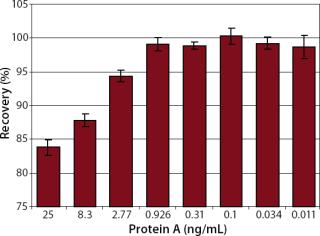
During purification of antibodies on protein A columns, small amounts of capture molecules often leach into the eluate along with a product antibody. The binding of protein A to it, therefore, may affect the accurate measurement of a product antibody. To address this, we tested the competitive influence of protein A with regard to the accuracy of antibody quantification by preparing solutions of 150 ng/mL hIgG4 (Ab2), spiking them with different concentrations of protein A, and analyzing them four times on one flow cell.
Kinetic Test Evaluating the Generic IgG Platform: To check the binding characteristics of different antibodies to the immobilized ligand, we performed kinetic analyses. We determined association and dissociation rates by injecting each analyte in different concentrations over the immobilized sensorchip. To normalize buffer effects, each analyte was sequentially injected over the detection flow cell and then over the reference flow cell. The signals were subtracted from each other during the data evaluation stage. We determined the association rates (ka), dissociation rates (kd), and dissociation constants (KD) in three independent assays by displaying the sensorgrams in overlay plots and fitting them on a 1:1-Langmuir model using BIAevaluation software from GE Healthcare.
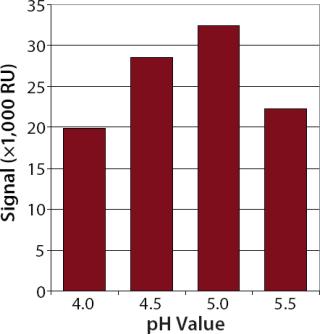
ResultsLigand Immobilization and Regeneration: Mouse anti-hIgG from Invitrogen (www.invitrogen.com) was covalently immobilized as a ligand. A high level of immobilized ligand is important for sensitive concentration assays. We diluted this ligand in acetate buffers with different pH values and injected it over a nonactivated flow cell to determine the best electrostatic concentration in the dextran matrix.
The best electrostatic concentration of the ligand came with 10 mM acetate buffer at pH 5.0 as a dilution buffer (Figure 1). Using this buffer for the immobilization procedure, we obtained an average immobilization level of ~11,000 resonance units (RU) (data not shown).
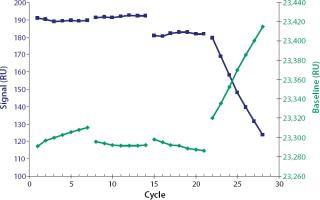
After each sample injection, the sensorchip surface was regenerated to dissociate the analyte from the ligand and prepare the flow cell for a new sample injection. We screened regeneration solutions to find a solution that fully dissociates the analyte–ligand binding without affecting the ligand’s binding activity. Scouting glycine-HCl solutions at the pH values of 3.0, 2.5, 2.0, and 1.5 were screened for seven cycles, respectively (Figure 2). In each cycle, 1,000 ng/mL of hIgG4 was injected for 120 seconds and then regenerated by injections of regeneration solution for 30 seconds. A stable baseline combined with a high and stable signal was obtained using 10 mM glycine-HCl at pH 2.5. An immobilized flow cell could be used for ~800 sample cycles under those conditions (data not shown).
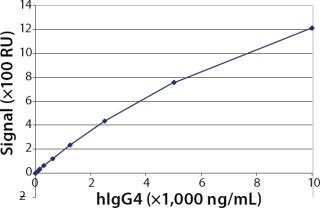
Working Range, Limit of Detection (LOD), and Limit of Quantitation (LOQ): To evaluate the working range of the assay, we generated a standard curve using purified hIgG4 (Ab2). The results in Figure 3 show the standard curve ranging 39.1–10,000 ng/mL in this Biacore assay. We set the working range of the assay from 156.1 to 10,000 ng/mL, which was confirmed by the experiments described below. Furthermore, we calculated the LOD by a signal-to-noise ratio of 3:1, which corresponds to an analyte concentration of 50 ng/mL hIgG4. We determined the LOQ using a signal-to-noise ratio of 10:1, which corresponds to an analyte concentration of 100 ng/mL.
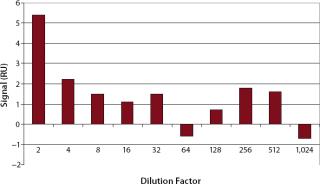
Specificity, Accuracy, and Precision: The minimum dilution of upstream and downstream samples must be determined for each step individually. In our test, we analyzed analyte-free cell culture medium in different dilutions to evaluate nonspecific signals (Figure 4). For comparison, we injected HBS-EP buffer eight times, which resulted in an average signal of 2.5±0.6 RU.
As Figure 4 shows, cell culture samples should be diluted at least 1:4 to prevent unspecific binding. From a dilution of 1:4, the corresponding resonance units (~2 RU) were in the range of the blank (2.5±0.6 RU). Therefore, in cell culture supernatants the LOD was 200 ng/mL and the LOQ was 400 ng/mL.
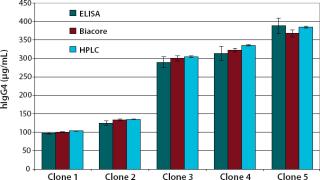
We examined the accuracy of the method by quantifying five different cell culture samples and comparing the results with those of a validated protein A-HPLC assay and a commercially available IgG-ELISA. The detected IgG4 concentrations compared well with both the validated protein A-HPLC assay and the ELISA. With the HPLC results set at 100%, we obtained recovery rates of 96–100% with the Biacore assay.
We checked the intermediate precision of our Biacore assay by quantifying one hIgG4-containing cell culture supernatant in four different dilutions on five different days and on five different flow cells (Table 1). The results of our study demonstrated precise results over the examined working range (100–10,000 ng/mL) with a maximum coefficient of variation (CV) of 5.7%. However, for practical reasons, we set the working range at 156.3–10,000 ng/mL.
Table 1: Intermediate precision; each concentration was measured on different flow cells and on different days (interflow cell precision; n=5).
Robustness: We performed robustness tests to evaluate chip storage conditions and process-related impurities (Figure 6 Figure 7). Ligand activity decreased ~90% within one month when the sensorchip was stored under dry conditions (Figure 6). By contrast, when the sensorchip was stored in HBS-EP over a month, only a ~25% loss of ligand activity could be detected (Figure 7). We also tested the competitive influence of protein A on the accuracy of antibody quantification and found that protein A concentrations <1 ng/mL had no effect on the quantitation of 150 ng/mL hIgG (Figure 8).
Affinity Dependence of a Generic Assay: Generic IgG concentration assays should be independent of the affinity between analytes and the immobilized ligand so that different immunoglobulins can be detected on one standard curve. In our tests, we checked the affinity dependence of the assay and performed kinetic measurements to compare the binding behavior with recovery rates.
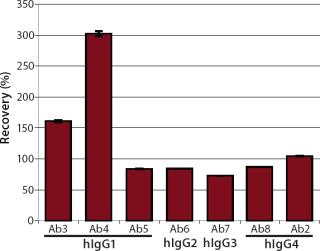
We quantified the recovery of different hIgGs on one standard curve to check whether the developed assay could be used as a generic platform. We tested four wild-type antibodies as analytes (Ab5, 6, 7, and 8), representing the four hIgG subclasses hIgG1 to hIgG4. Two monoclonal hIgG1 (Ab3 and Ab4) antibodies were also tested. As a positive control, hIgG4 (Ab2) was quantified on the standard curve, which was performed using hIgG4 (Ab2). Each analyte was diluted with HBS-EP running buffer to a final protein concentration of 1 µg/mL and injected five times. We calculated the recovery rates based on a target concentration of 1 µg/mL (Figure 9).
Significant under- and overestimation could be shown by quantifying different antibody subtypes on one standard curve. A recovery rate of ~100% was reached only when analyte and standard material were identical (Ab2). We determined the concentrations of three wild-type antibodies — hIgG1 (Ab5), hIgG2 (Ab6), and hIgG4 (Ab8) — with recovery rates of ~85%, whereas the wild-type antibody hIgG3 (Ab7) was detected with a recovery rate of ~73%. The recovery rates of both monoclonal hIgG1 antibodies were ~150% and 300%, respectively. However, we obtained high precision (CV < 2%) for each antibody quantification.
To analyze the different analyteligand binding behavior, we subsequently performed affinity studies. By contrast with concentration assays, only small amounts of ligand should be immobilized for kinetic assays. For this purpose, we performed our assay with an immobilization level of 60 RU.
The results of the kinetic studies (Table 2) correlated very well with the recovery rates of the standard dependent measurements (Figure 9). The monoclonal hIgG1 with the highest recovery rates (Ab3 and Ab4) also showed the highest association rates (ka) of 4.1×10⁴ and 1.0×10⁵ M−1s−1. Comparable recovery rates of the three wild-type antibodies (Ab5, 6, and 8) were also reflected in comparable association rates from 1×10⁴ to 2.5×10⁴ M−1s−1. The wild-type antibody hIgG3 (Ab7) showed both the lowest association rate (3.0×10³ M−1s−1) and the lowest recovery rate (73%).
Table 2: Average association and dissociation rates are listed with the dissociation constants of different antibodies to the immobilized ligand (n=3).
To optimize the sensitivity of an immunoassay, high amounts of ligand must be immobilized to provide many binding sites for the ligand–analyte interaction because the signal of a Biacore concentration assay directly depends on the amount of bound analyte (1). Under the elicited conditions (50 µg/mL anti-hIgG in 10 mM acetate at pH 5.0), we obtained an average immobilization level of 11,000 RU. This corresponds to a protein concentration of ~11 ng/mm2 (2). The common immobilization level for proteins of MW 50–150 kDa is between 7,000 and 20,000 RU (3).
Furthermore, complete regeneration of the analyte from the sensorchip surface is essential for an accurate and precise assay to provide the same binding capacity for each analyte injection (3). Besides the complete removal of the analyte, the conservation of ligand binding activity must also be considered. Incomplete regeneration or loss of binding activity from the surface will affect the performance of an assay and shorten the lifetime of the sensorchip (3). You can determine the quality of regeneration by comparing baseline signals from cycle to cycle and examine conservation of ligand binding activity by comparing analyte signals of repeated injections with identical analyte concentrations (Figure 2).
Glycine-HCl, pH 3.0, did not fully regenerate our sensorchip (shown by the increasing baseline signal). Evidently, harsher conditions at pH 2.0 influenced the ligand binding activity because the analyte signals obtained decreased from cycle to cycle. At pH 1.5 the ligand was clearly denaturized, (shown by strongly decreasing signals and an increasing baseline). The most successful regeneration was achieved by injecting glycine-HCl at pH 2.5, for 30 seconds. Under such conditions, immobilized flow cells could be used for ≤800 cycles.
To elicit the working range, we generated a standard curve (39.1–10,000 ng/mL) and evaluated both LOD and LOQ by determining signal-to-noise ratio. After evaluation of the results obtained during accuracy and precision studies, we set the working range at 156.3–10,000 ng/mL. With about two log ranges, this assay is comparable with published Biacore concentration assays (4,5,6). Compared with protein A-HPLC (working range 10–100 µg/mL), the Biacore C method was more sensitive. The ELISA was the most sensitive method but also the least precise, with a working range of 7.8–500 ng/mL.
The Biacore assay described here can detect low titers with high precision. Therefore, this method can be used from the start of cell line development through product purification to release of a final product. By contrast, only higher hIgG concentrations can be measured with the traditional protein A-HPLC. Interflow cell measurements on different days covering the examined working range showed that the method provides good intermediate precision with CVs < 6%. Comparable Biacore antibody assays have CVs of ≤20% (5).
The superior accuracy of the Biacore assay can be shown by quantifying different harvest samples and comparing the results with a validated protein A-HPLC and a commercial hIgG-ELISA. With recovery rates of 96–100% compared with the HPLC, our assay is more accurate than other Biacore assays, which have recovery rates of 90–120% (6). The recovery rates of the commercial ELISA were 92–101% compared with the HPLC and were thus less accurate than our Biacore assay.
Because of the range of applications for surface plasmon resonance, an immobilized sensorchip must be stored outside the instrument. In a docked sensorchip, low buffer flow conserves ligand activity. Our testing of storage conditions for the sensor chip outside the Biacore C instrument showed that ligand activity could be best conserved in HBS-EP at 2–8 °C for at least a month.
Additionally, we tested the robustness of our assay with regard to process-related protein A impurity. Affinity chromatography in protein A columns is a common method in biotechnological processes for the purification of monoclonal antibodies following fermentation. Because of the high specificity of protein A constructs to the Fc-region of antibodies, a product purity of >98% can be obtained in a one-step process (7, 8). Usually, small amounts of leached protein A (up to 50 ng/mL) remain in the eluate of protein A columns (4, 8). We show here that protein A concentrations up to 1 ng/mL did not influence hIgG quantification. Generally, IgG concentrations in protein A eluates are in the milligram range, so small amounts of protein A would not significantly influence the quantitation.
Apart from concentration, immunological methods also can be used to determine the biological activity of analytes, which is an advantage of surface plasmon resonance over analytical chromatography. In an HPLC assay, an immobilized ligand must bind to an epitope existing only in the active conformation of the analyte, and therefore inactive molecules are not bound (9,10,11). In Biacore assays, the total analyte amount and the amount of active molecules can be determined (12). With the protein A HPLC assay, only the total amount of protein can be determined. Therefore, HPLC assays must be combined with additional assays for activity determination.
A generic assay that can quantify different hIgG subtypes on one standard curve is both time- and cost-saving. To produce accurate measurements, each analyte must bind the ligand with the same velocity to generate comparable signals during a defined injection time. The binding affinity between two molecules can be amplified by the substitution of one amino acid in the binding region of a molecule (13).
Quantifying different antibodies on one standard curve showed that precise (CVs < 2%) but inaccurate results were obtained. Good recovery rates were reached only when the standard material and analyte were identical. This fact must be considered when a generic IgG assay is used in a biopharmaceutical environment.
AN AUTOMATED ALTERNATIVEWe developed and qualified a Biacore concentration assay for quantification of hIgG4. The intermediate precision of <6% and 96–100% recovery rates enabled precise and accurate quantification of hIgG4 in cell culture supernatants The elicited working range was 156.3–10,000 ng/mL hIgG4. During robustness studies, we tested the effects of storage conditions and contaminations. Immobilized sensorchips always should be stored in HBS-EP running buffer to conserve ligand activity for several weeks. Furthermore, we have shown that protein A contaminations ≤1 ng/mL do not affect hIgG quantification in protein A eluates.
Different immunoglobulins were quantified precisely but with an unacceptable level of accuracy on one standard curve. Due to affinity dependence, high accuracy was obtained only when the standard and analyte were identical. Kinetic studies proved that different immunoglobulins bound the ligand with varying association rates.
Compared with other regulatory-compliant analytical methods, surface plasmon resonance has several favorable characteristics. Our Biacore assay is more precise and accurate than a commercially available IgG-ELISA, and hands-on time is reduced by its high degree of automation. Concentration measurements with a protein A-HPLC assay are less sensitive (µg range) than with the Biacore assay (ng range). Therefore, the latter can be used to analyze low-concentration samples, such as those occurring during early stages of cell culture processing. In addition, HPLC can detect only the total protein amount, not the biological activity of an analyte. Concentration measurements using analytical chromatography must be combined with activity assays to determine the concentration of active protein. By contrast, an appropriate Biacore assay can determine the total amount and the active amount of analyte in the same assay.

