Broadley-James Corporation, Emerson Process Management, and the University of Texas at Austin are working together to examine and quantify the potential for faster optimization of batch operating points, process design, and cycle times. We’re also looking for more reproducible and predictable batch endpoints.
The objective of this effort is to show that the impact of PAT can be maximized through the integration of dynamic simulation and multivariate analytics in a laboratory-optimized control system during product development.
Data from bench-top and pilot-plant cell culture runs are being used to create multivariate analytic and high-fidelity, first-principle cell culture models to prototype process changes. The tools that are being used could provide significant improvement in process development and process control by laying a foundation for real-time release capabilities as defined by the PAT guidelines (1). Potential benefits include a more automated, seamless, and effective commercialization process that should translate to faster time to market and early release of biological products.
Currently more than 400 biotechnology medicines are in development for more than 100 diseases (2). These products generally require overlapping and iterative stages for process development and commercialization: cell line selection and development, media optimization, process conditions optimization and verification, scale-up, project definition, and plant design.
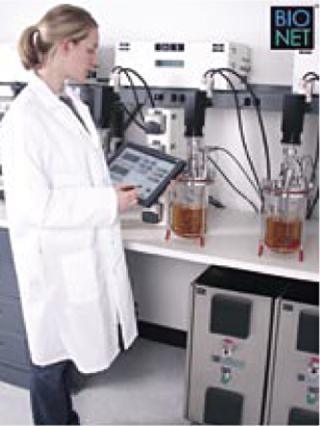
Photo 1:
Beta tests are in progress to explore the use of a new dynamic model and online data analytics in the development and scale-up of new products derived from mammalian cell lines. A key objective is to make results fully public to encourage extensive use and advancement of the concepts and methodology.
Although our tests involve bench-top and pilot-plant bioreactors, these tools are important for industrial bioreactors as well. Data collected during product and process development often may be the best source for initial model development, particularly because changes must be minimized in production runs. Using these tools in a laboratory provides an opportunity to evaluate their performance and establish an effective basis in a production system for real-time release.
Laboratory Set-Up
The CHO cell line for these beta tests uses a glutamine synthetase (GS) expression system to produce an antibody. GS catalyses biosynthesis of glutamine from glutamate and ammonia. The GS expression system uses methionine sulphoxamine (MSX) in culture media to inhibit endogenous GS. These CHO cells are modified with the recombinant protein of interest and an exogenous GS selective marker (3, 4). No exogenous glutamine can be added to this system, or the selection pressure will break down and lead to a culture with a great deal of genetic drift for the recombinant protein being produced. Another side effect of this metabolic change is that the GS system consumes its own waste ammonia, so ammonia levels tend to be lower in these cultures. These cells also tend to produce less lactate. Consequently, this system requires less sodium carbonate to maintain pH, resulting in lower osmolality than other CHO selection systems. The lower ammonia and osmolality levels contribute to an increase in culture longevity, resulting in batch times of 22-30 days rather than the 10-12 days normally associated with CHO lines. Cells are maintained and batches are run in a proprietary, serum free media supplemented with glutamate before and during the run.
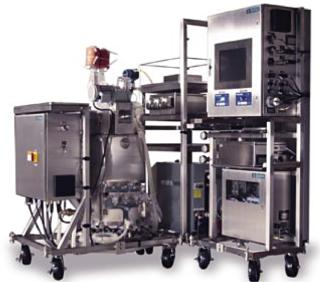
Our laboratory bioreactors are controlled by a laboratory-optimized industrial distributed control system (DCS) that can use embedded modeling, analytical, monitoring, tuning, and advanced control tools. For the beta tests, we embedded those tools in a new DCS station that was connected by OPC communication protocol to an existing laboratory DCS application station. Multiple 7-liter bench-top bioreactors are connected to the laboratory DCS (Photo 1) for process optimization and model development. A 100-liter jacketed pilot-plant size “single-use” bioreactor (Photo 2) was connected to the laboratory DCS for scale up of the process and the model.
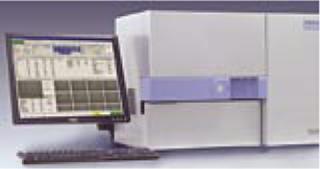
A key part of our test set-up is the use of on-line and at-line analytical measurements. Each bioreactor has a near-infrared (NIR) probe and a dissolved carbon dioxide (DCO2) electrode as well as dissolved oxygen (DO) and pH electrodes. Our at-line analyzer (Photo 3) has an automated sample system that every four hours provides measurements of lactate, ammonia, glutamine, glutamate, cell count, cell viability, cell diameter, and osmolality. These measurements enable an extension of basic control (e.g., proportional and proportional-integral control) and the addition of advanced control (e.g., model predictive control) for cell culture. These feedback controllers inherently transfer variability from key process variables (e.g., DO and media formulations) to feeds (e.g., air, O2, glucose, and amino acids) and provide a standardized and direct method for adjustment of the process variables according to their set-points by a higher level of control or supervision (5).
Additionally a method has been developed to provide the fastest possible automated approach to a PID controller set-point (3). The extension of feedback control offers these advantages:
-
eliminates the need to develop schedules for automated dosing or feed profiling
-
makes design of experiments less complex
-
allows for fewer batches for design of experiments
-
provides more reproducible batches
-
speeds transitions to new process conditions
-
facilitates more effective data analytics by elimination of unmeasured disturbances
-
improves commercialization of optimization opportunities by making them faster and more definable.
Model Structure, Set-Up, and Use
Our dynamic model uses first-principle differential equations to calculate mass and energy balances for liquid, bubble, and head spaces. We set up the equations to handle batch, continuous, or perfusion processes. Population balances are used for cell viability and size, and pH is computed from a charge-balance equation. Mass transfer coefficients are calculated from empirical relations for gassed power and for the transition between turbulent and laminar regions. We used Michaelis-Menten inhibition and limitation kinetics with neural network options for the effects of ammonia, lactate, DO, hydrogen ion, and substrate concentrations on growth and formation rates. Our model also readily accepts other kinetic rate calculations.
Photo 2:
<
div style='float:left;margin-left:0px;margin-top:5px;margin-right:0px;margin-bottom:7px;background-color: #f7f7f7;width:auto;'>
The effect of temperature on kinetics is modeled by an empirical simplification of the Arrhenius equation. A recent study concluded that intracellular concentrations need not to be modeled because intracellular kinetics are much faster than cell growth (6). Consequently, a first-principle model of cell and medium concentrations can provide a useful indicator of complex metabolic pathways.
Although this model was developed for a mammalian cell process, the structure and library modules are general enough to model products made by bacterial, fungal, and yeast fermentations as well. Previous studies indicate that the model can be used to prototype-model predictive control of growth and product formation rates that can reduce batch times by 40% and improve yields by 10% (5). The generic building-block nature of our modules enables the library to be used and expanded to simulate chemical and secondary processes.
Model Speed-Up: We use a combination of kinetic, phase, and DCS module execution real-time factors to speed-up our model by up to 1,000 times real-time. Alternatively, batch data generated by a virtual or actual bioreactor can be replayed at 1,000× real-time depending upon CPU capability relative to the complexity and number of modules. These speed-up factors mean that a 22-day virtual bioreactor batch becomes a 32-minute batch. Furthermore, a 22-day actual bioreactor batch can be played back in 32 minutes. Whereas a 1,000× virtual bioreactor batch could conceptually be played back in a couple of seconds, our virtual batch play-back may take three minutes due to CPU and resolution limitations.
Embedding of the modeling, analytical, monitoring, and advanced control tools means that our DCS module execution real-time factor and playback speed have no effect on controller tuning or results. Initial simulation studies have shown that proper handling of scale-up (volumes, mass transfer rates, and flow rates) in this model provides similar batch profiles of cell count and product concentration.
Our model plays a key role in defining and prototyping feedback control systems that can accelerate process development and commercialization. The model can predict process dynamics (process gain, dead time, and time constant) and the controller tuning settings (controller gain, reset time, and rate time). Recently released, embedded, on-line loop performance monitoring and controller tuning tools identify loops with significant variability that could be improved by better tuning (7). Process dynamics and controller tuning settings are automatically identified whenever a set-point is changed. Results from such performance monitoring of an actual bioreactor can be used not only to improve actual bioreactor operation, but also to improve model fidelity by a better match of process dynamics and controller tuning.
Model Use: A small subset of our model can be used to provide a more robust and optimal design of experiments (DOE) for identification of model parameters (8). Only the differential and algebraic equations (DAE) for viable cells, ammonia, lactate, glutamine, and product are involved. Feedback control of DO, pH, temperature, glucose, and glutamate eliminates the DAE for these process variables as well as the need for DOE yield and maintenance factors. Controller set-points are manipulated by the DOE, thereby eliminating the need for flow scheduling and profiling.
Photo 3:
Studies indicate that these DAE for the DOE can find a kinetic parameter value by five set-point changes in an associated loop at pertinent times in a batch cycle. The DOE results are also used for finding better operating points (set-points) for a process. We expect that the DOE will be an iterative process in which initial experiments are used for finding better process conditions and model parameters. A virtual bioreactor then runs faster than real-time to deepen process understanding and develop a more effective DOE, which further improves both process and model. The results may also lead to improved media formulation and cell-line attributes. Bench-top bioreactors, online and automated at-line analysis, data analytics, loop performance monitors, and feedback controllers reduce variability not related to DOE.
This approach offers several potential opportunities for faster process optimization and base-line verification:
-
exploration of new operating regions
-
focusing of further DOE
-
evaluation of “what-if scenarios”
-
diagnostics for abnormal batches
-
deepening of process understanding
-
prototyping of advanced controls and data analytics for monitoring and end-point prediction
-
demonstration and verification of batch conditions and profiles.
Additionally, embedded advanced tools can automatically schedule changes in set-points and identify process dynamics that can be used to schedule tuning settings and to provide model predictive control of metabolic rates (5, 9).
Virtual Plant
Our model, configuration, and tools can be exported as modules and downloaded to a personal computer or a DCS station or controller for use as a :“virtual plant” to generate or play back batches faster than real-time (9). Alternatively, these modules can be downloaded to a DCS connected to an actual bioreactor. Applications have shown that an innovative MPC application can adapt online model parameters and provide inferential measurements (5, 9, 10). In this mode, the virtual plant runs a virtual duplicate of the control system in parallel with the actual control system. The virtual controllers use the same set-points as the actual controllers for primary process variables (5, 9, 10). So there are four principal modes of running a virtual plant:
-
real-time connection to an actual bioreactor
-
100–l1,000× real-time as a stand-alone virtual bioreactor
-
1,000× real-time for fast play-back of an actual bioreactor
-
10,000× real-time for fast play-back of a virtual bioreactor.
If proper scale-up factors are applied, the embedded tools go readily from bench-top bioreactors to pilot plants and eventually industrial-scale bioreactors. Our embedded, integrated, and preconfigured approach eliminates the need for separate programs, OPC interfaces, data formatting, and special skills for set-up and use of the control system and PAT tools. A process engineer can concentrate more on process design without having to play the additional roles of statistician and control engineer (9).
The virtual plant has three distinguishing features
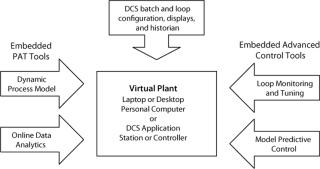
. The first is an ability to use the actual configuration, historian, displays, and advanced control tool-set of an industrial DCS (without translation, emulation, special interfaces, or custom modifications) that is integrated with the process model (Figure 1). The configuration database is downloaded; and files for operator graphics, process history charts, and data history from the real plant can be copied to the same computer so users have the controls and unit operations in one place. The second key feature is the capability to run much faster than real-time in simulation and play-back modes. The third key feature is portability. This control system can be “scaled up” from a laboratory to an industrial plant by changing flow scales, input and output assignments, and adding operations not automated in the laboratory. And that reduces the time for project definition and control system configuration, check-out, training, and bioreactor commissioning. The virtual plant runs on any computer, anywhere to provide PAT tools with the same interface and working environment as an industrial DCS, as elucidated in the “Top 10 List” box (9).
On-line Data Analytics
It is now generally recognized that product quality and performance quality cannot be “tested into” products, but rather should be built-in by design. The PAT guideline advocates that manufacturers focus on understanding relevant multifactorial relationships among materials, manufacturing processes, environmental variables, and their effects on quality. One of four tool categories defined by the guideline to advance process understanding is “multivariate tools for design, data acquisition, and analysis.”
TOP 10 REASONS WE USE A VIRTUAL (RATHER THAN A REAL) PLANT
10
Can’t freeze, restore, and replay an actual plant batch
9
No separate programs to buy, learn, install, interface, and support
8
No waiting on laboratory analysis
7
No raw materials to procure and warehouse
6
No environmental waste to handle
5
Virtual instead of actual problems
4
Batches done in 15 minutes instead of 10 days
3
Can operate plant on a tropical beach if we want
2
Last time we checked our wallet, we didn’t have $100,000,000 on hand.
1
A real plant doesn’t fit in our suitcase.
Multivariate tools may be used to identify and understand relationships that are important in the design and development of biomanufacturing processes. Such tools may be used on-line to identify processing difficulties that can lead to failure of a product to meet specifications. The ability to predict performance can provide a high assurance of quality on every batch and thus presents alternative mechanisms to demonstrate validation. In a PAT framework, validation can be demonstrated through continuous quality assurance when a process is continually monitored, evaluated, and adjusted using validated in-process measurements, tests, controls, and process end-points.
One target in applying multivariate analytic tools is to provide an alternative procedure for final-product release. As defined by the PAT guideline, real-time release is the ability to evaluate and ensure acceptable quality for in-process and/or final products based on process data. The combined process measurements and other test data gathered during a manufacturing process can serve as the basis for real-time release of the final product. With real-time quality assurance using multivariate techniques, desired quality attributes may be ensured through continuous assessment during manufacture. However, the multivariate tools selected and supporting work performed during process design and analysis will influence whether it is possible to achieve the goal of real-time release. Thus, the use of on-line multivariate tools will be an integral part of the beta test.
Analytic Tools: A number of multivariate statistical modeling techniques may be used to identify and study the effect and interaction of product and process variables. The two multivariate analysis techniques most often provided in multivariate tools to analyze continuous and batch process operations are principal component analysis (PCA) and projection to latent structures (PLS).
Principal Component Analysis: When used appropriately, PCA enables identification and evaluation of product and process variables that may be critical to product quality and performance. Equally important, this tool may be used to develop an understanding of the interactive relationship of process inputs and measurements and on-, in-, or at-line analysis of final product. When applied on-line, PCA may be used to identify potential failure modes and mechanisms and to quantify their effects on product quality.
Projection to Latent Structures: Also known as partial least squares, PLS may be use to analyze the impact of processing conditions on final-product quality parameters that are often measured using on-, in-, or at-line analysis of final products. When this technique is applied in an on-line system, it can provide operators with continuous prediction of end-of-batch quality parameters.
Successful application of these statistical multivariate techniques depends in part on the toolset selected. Various techniques for PCA and PLS model development have been implemented in commercial products. In some cases, a product may be designed to support only the analysis of continuous processes. In such applications, data analysis and model development often assume that a process is maintained at just one operating condition.
To successfully address the requirements of batch processes common to the pharmaceutical industry, it is important that multivariate tools be designed to address varying conditions over a wide range of operation. Multiway PCA and PLS algorithms are commonly used in multivariate tools to address batch applications. Tools that support such algorithms are designed to allow a normal batch trajectory to be a
utomatically established for each process input and measurement. PCA and PLS statistical analyses are then applied to deviations of those processes parameter measurements from their defined trajectories.
Hybrid Unfolding and Dynamic Time Warping
In some cases, collection of process data in a format that can be used by a given analytic tool is one of the greatest challenges in PCA and PLS model development. However, when those tools are integrated into control systems, it becomes possible for a manufacturer to automatically provide information for each batch. Three techniques have traditionally been used to unfold batch data for use in model development: time-wise unfolding, variable-wise unfolding, and batch-wise unfolding. However, for on-line PCA analysis, a relatively new approach known as hybrid unfolding offers some significant technical advantages (7).
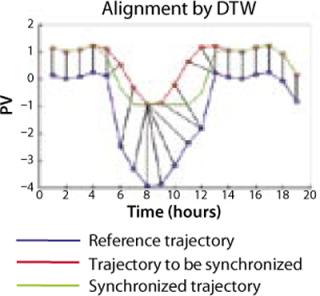
Another area with significant differences in commercial products is the manner in which variations in batch times are addressed in model development and in on-line application of PCA and PLS. A relatively new technique known as dynamic time warping (7) allows such variations to be addressed by automatically synchronizing batch data using key characteristics of a reference trajectory (Figure 2).
Once PCA and PLS models have been developed using data from normal batches, then their performance in detecting faults and predicting variations in end-of-batch quality parameters may be tested by replaying data collected from abnormal batches. Most commercial modeling programs provide some facility to test a model in this manner. Once the model has been tested, then in some on-line systems it will be used only to report faults at the end of each batch. However, much more benefit may be achieved by using PCA and PLS analysis on-line. So our beta test will focus on such on-line application of those techniques.
In an on-line operation, deviations in quality parameters are detected through PLS. PCA can be used to detect abnormal operations resulting from both measured and unmeasured disturbances:
Measured Disturbances: The impact of measured disturbances can be quantified by applying Hotelling’s T2 statistic. Deviations in this statistic above a threshold value indicate abnormal conditions. It is a multivariable generalization of the Shewhart chart (5).
Unmeasured Disturbances: Changes in unmeasured disturbances that affect an operation can be quantified by applying the Q statistic, also known as the squared prediction error (SPE). This statistic measures deviations in process operation that are not captured by process measurements (5).
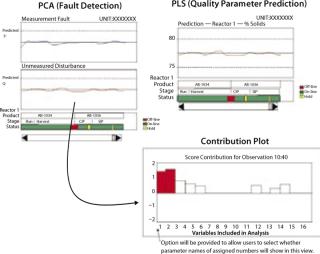
A contribution plot can show how each process variable contributed to a deviation in the PCA statistic. Using the PLS model for on-line evaluation of a batch progression, operators can get a continuous indication of predicted quality parameters at the end of each batch. The operator interface for on-line PCA and PLS can be structured in many ways. One example is illustrated by Figure 3.
Analytic Model Development
Data gathered from simulations of processes and control systems may be used to develop initial PCA and PLS models. Before process information is collected to support development of PCA and PLS models, it is important that measurements and control loops are functioning properly (e.g., loops are “well tuned”) (5). Process operating conditions may need to be changed during a batch to allow interactions between process parameters to be seen and captured in the model. Because such changes may be impossible in a validated manufacturing system, these analytic tools ideally should be introduced during development. Data collected from experiments conducted during product and process development may often be the best for initial model development. Once a process is scaled up to production scale, parameter trajectories and model scaling for its PCA and PLS models may need to be updated. Using these tools during product development thus provides an opportunity to evaluate their performance and lays a foundation for their use in a production system for real-time release.
What’s Next
We have tests in progress for synergistic use of automated at-line analysis and an industrial DCS with new embedded PAT tools and existing advanced control tools for optimizing bench-top, pilot-plant, and virtual-plant runs. We use a high-speed virtual plant to reduce the time required for process optimization, verification, scale-up, and design. The portability and utility of the model, control system, and PAT tools should lead to faster project schedules and more reproducible and efficient industrial production. Full public disclosure is planned to promote a widespread advancement in the state of the art.
REFERENCES
1.) CDER/CFM/ORA 2004.Guidance for Industry: PAT — A Framework for Innovative Pharmaceutical Development, Manufacturing, and Quality Assurance. U.S, Food and Drug Administration, Rockville.
3.) Bebbington, CR. 1992. High-Level Expression of a Recombinant Antibody from Myeloma Cells Using a Glutamine Synthetase Gene As an Amplifiable Selectable Marker. Bio/Technol. 10:169-175.
4.) Cockett, MI. 1990. High Level Expression of Tissue Inhibitor of Metalloproteinases in Chinese Hamster Ovary (CHO) Cells Using Glutamine Synthetase Gene Amplification. Bio/Technol. 8:662-667.
5.) Boudreau, M, and G. McMillan. 2006., New Directions in Bioprocess Modeling and Control. Instrumentation, Systems, and Automation Society, Research Triangle Park.
6.) Haage, JE, AV Wouwer, and P. Bogaerts. 2005. Dynamic Modeling of Complex Biological Systems: A Link Between Metabolic and Macroscopic Definition. Mathemat. Biosci. 193:25-49.
7.) Blevins, T, and J. Beall. March 2007 (supplement). Monitoring and Control Tools for Implementing PAT. Pharmaceut. Technol..
8.) Asprey, SP, and S. Macchietto. 2002. Designing Robust and Optimal Dynamic Experiments. J. Process Control 12:545-556.
9.) Boudreau, M. November 2006 (supplement). Maximizing PAT Benefits from Bioprocess Modeling and Control. Pharmaceut. Technol..

