Polymers provide a unique set of material properties, including toughness, chemical resistance, versatility, and low cost for both multiple-use and single-use bioprocessing systems. Polymer materials are manufactured as fittings and tubing for research and development (R&D) laboratories, as containers for bulk chemical and biological storage, as filters and separation technologies for downstream processing, and as containers and bottles for drug substance storage. These components and systems are helping drug companies improve their manufacturing flexibility, reduce their operating costs and capital spending, and shorten their drugs’ targeted time to reach clinical trials.
Along with the benefits of polymer materials come concerns about how extractables and leachables could influence manufacturing processes — and ultimately pharmaceutical product safety, efficacy, and/or stability (1). Industry organizations such as the American Society of Mechanical Engineers (ASME) and its bioprocess equipment (BPE) committee, the International Society for Pharmaceutical Engineers (ISPE), and the Bio-Process Systems Alliance (BPSA) are all developing standards (2), guidelines, and testing recommendations (3) that companies can use to evaluate the impact of a given polymer on their process fluids.
It is important to realize that not all polymer components are the same. Different grades of a given polymer family will contain different amounts of a number of additives. Moreover, improper processing (e.g., during extrusion and injection molding) of polymers can dramatically increase their potential to release extractables and leachables such as metals, anions, and organic molecular species. Therefore, here we explore the relationship among polymer processing conditions, degradation (reduction in polymer chain length), and potentially harmful extractables and leachables.
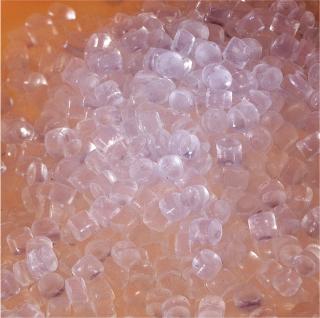
The polymer we used in our study was DuPont Teflon PFA 450 HP (PFA 450 HP) (lot #9710THP81). It is a high-purity, melt-processible poly(tetrafluoroethylene) (PTFE) copolymer. We chose it based on our long history of extruding the resin. Because it is free of additives, it has very low extractable levels if it is processed correctly. Here is the molecular structure of PFA 450 HP: CF3– [CF2– CF2]N – [CF2 – CF(OC3F7)]0.03N– CF3. The molecule contains ~97% tetrafluoroethylene monomer. The remaining comonomer is perfluoro propyl vinyl ether. Its trifluoromethyl end groups are fully fluorinated.
PFA is sensitive to shear. To intentionally cause different degrees of degradation, PFA 450 HP (lot #9710THP81) was extruded as 1-in. diameter tubing using a wide range of screw speeds and barrel temperatures. We quantified the extent of polymer degradation by examining the change in its melt flow rate (MFR) with a Kayeness Galaxy I melt flow indexer. The die radius was 0.1048 cm, and its length was 0.80 cm. We cut the extruded tubing specimens into small pieces, then loaded them into the indexer at 372 °C without drying, and allowed them to preheat for six minutes before applying a 5,000-g load. The MFR of PFA before processing is abbreviated as MFR0 and after extrusion as MFR1, and we report those values in dg/min. We measured each sample in triplicate.
To determine extractable fluoride anion concentrations [F–], we used ion chromatography (IC). First we filled heat-sealable Kapak/Scotchpak bags with 18 MΩ deionized water, then heat-sealed and boiled them for two to three minutes in a microwave. Then we cut open the bags along their top edges and poured the water out before rinsing them six times with 18 MΩ deionized water.
Afterward, we placed a 9-g sample of tubing into the cleaned Kapak bags along with 20 mL of 18 MΩ deionized water. In addition, we prepared three bags with no samples and 20 mL of water as controls. Then we heat-sealed the bags and placed them into 85 °C water. Samples were extracted for one hour at 85 °C, then analyzed with a Dionex DX-100 ion chromatograph. We report fluoride anion values in micrograms per gram (µg/g). Each tubing type was tested in triplicate.
Equations 1–7
Equation 1

Equation 2

Equation 3

Equation 4

Equation 5

Equation 6

Equation 7< /p>

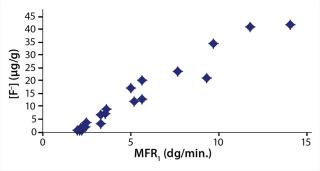
On receipt, 450 PFA had an MFR0 of 2.0 dg/min. Depending on the severity of the extrusion process, MFR1 values ranged from 2 to 14 dg/min. Not only can an increase in MFR lead to loss of long-term mechanical performance, but in the case of PFA, it can also cause an unwanted increase in anionic contamination. Figure 1 compares fluoride anion concentration [F–] of PFA with postextrusion melt flow rate (MFR1). Note the strong correlation.
Why does [F–] increase with the melt flow rate? Overaggressive processing breaks the molecular chains of PFA, thereby creating fluorocarbon radical end groups, –CF2•. Those radicals react with oxygen and a hydrogen donor to produce unstable hydroxyl end groups, –CF2OH, which subsequently decompose to carbonyl fluoride, –C(O)F, and hydrogen fluoride, HF (4). Here is a summary of the reaction scheme:
–CF2 – CF2– → –CF2• + O2 + H donor → –CF2OH → –C(O)F + HF
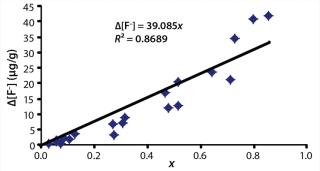
Hydrolysis, thermal decomposition, or further oxidation can trigger additional reactions that lead to more HF generation (4). In IC analysis, HF or its by-products manifest themselves as fluoride anions. Therefore, it can be assumed that the rise in fluoride anion concentration (Δ[F–]) increases linearly with the fraction of broken chains (x) (
Unless extremely severe process conditions were used, it is unlikely that all polymer chains would be broken. By using MFR measurements, we estimated the value of x. Consider a polymer chain with an initial length of N monomer units. If indeed a fraction of chains were broken during processing, then the chain length of the once processed specimen (N1) would be reduced according to
The flow characteristics of molten polymer are strongly influenced by chain length (5). The melt viscosity (η) of PTFE exhibits a 3.2 power law dependence on chain length (6) (
Combining
That suggests that breaking every chain of 450 PFA would have caused the MFR of 450 PFA to increase from MFR0 = 2 dg/min before processing to MFR1 = 18.4 dg/min after extrusion.
That analysis can be carried one step further by combining
The Δ[F–] values estimated for complete chain scission from the IC data using
Fluoride anion generation is specific to certain types of fluoropolymers, such as PFA. Although we have focused on PFA in our study, all polymers are susceptible to overly aggressive processing. Chain breakage in polyolefins (e.g., polyethylene or polpropylene), polyamides (nylons), and vinyl acetate copolymers (EVOH) can generate ions and/or mobile organic molecules that could be detrimental to biopharmaceutical products.
Watch Out for AnionsOveraggressive processing can degrade polymers. The rise in melt flow rate due to “degradation” is a consequence of chain breakage. In PFA, chain breakage also creates reactive end groups that generate unwanted fluoride anions. Chain breakage and the resulting increase in fluoride anions can be estimated from melt flow rates or melt viscosities.
Author Details
Corresponding author C.W. Extrand is director of research and development for life sciences, J. Schafbuch was a process engineer in manufacturing, and corresponding author M.W. Johnson is an applications engineer in life sciences at Entegris, Inc., 129 Concord Road, Billerica, MA 01821; 1-952-556-4085;


