Continuing the theme of this occasional series, we examine the role of manufacturing in the supply chain in terms of what is required to deliver affordable medicines to patients. The industry has debated the relevance of manufacturing costs in the overall big picture (1). Rising manufacturing costs as a proportion of the overall selling price coupled with increased competitive pressures creates a strong drive to reduce manufacturing costs. However, cost of goods (CoG) is not the only strategic driver. Other important factors associated with bulk manufacturing are
- capital intensity (capital expenditure as a percentage of sales)
- timing of cash flows
- time taken to bring new capacity on board
- responsiveness to changes in demand
- flexibility, the ability to change over to a new product.
Inability to tackle some of those factors has caused significant problems for the biopharmaceutical industry during the past decade. A combination of capital intensity, uncertainty regarding product success, and long lead times required to build a large-scale facility has resulted in redundant capacity (2). Much capacity is no longer needed, and it is often not economically viable to change its use. The urgent challenge facing our industry is how to deploy and develop manufacturing systems that are flexible, quick to build, and less capital intensive. Advances in technologies and changing product requirements are significantly influencing companies’ approaches to facility design and deployment and the options available today. Typical considerations now include
- What is the role of disposables in facilities, and to what extent are they used?
- What are the true benefits of modularization, and where does it have the most impact?
- Is continuous processing an option, and if so, where and how should it be deployed?
- Should underused legacy facilities be replaced?
In this and subsequent articles we will address those issues. Here, we review optimal strategies for using disposables in hybrid facilities (a mixture of stainless and disposable technologies). In particular we examine the costs of such facilities, their scalability, and their advantages over a reference stainless steel facility.
Hybrid Disposable Manufacturing for Cell Culture
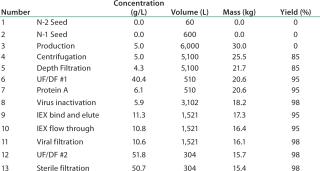
The basis of this analysis is a platform monoclonal antibody (MAb) manufacturing process (Table 1) with an expression level of 5 g/L and an overall yield of 51%. The goal is to manufacture ~450 kg of bulk purified product using 6,000 L of installed bioreactor capacity. Table 2 lists the exact configuration. The hybrid facility uses a mixture of proven commercially available disposable technologies and stainless steel equipment (Table 3). Questions to be addressed are
- What is the best configuration for a hybrid facility — multiple 1,000-L or 2,000-L bioreactors?
- What harvest configuration should be used in terms of pooling bioreactor harvests?
- How does the best hybrid option compare with stainless steel when changing facility use?
Table 1: Process details
Table 2: Scenario configuration
Table 3: Hybrid disposable options
To answer those questions, we consider the option that gives the best return on investment. First, we evaluate the scenarios in terms of CoG and more rigorous approaches that take into account cash flow and risk (see “Measuring the Cost” box).
To carry out the analysis, we used the commercially available BioSolve Process software package (Biopharm Services). The software includes standard cost data provided by vendors, engineering companies, and end users (all data updated annually) and was used to set up the process options. It also includes an add-on module for carrying out more sophisticated return on investment (ROI) and net present value (NPV) analyses. We evaluated five scenarios. Key assumptions used for the ROI and NPV analyses are
- spending profiles capital project: stainless steel over four years (10%, 40%, 40%, 10%); disposable over three years (23%, 57%, 20%)
- discount factor of 15% used in the NPV calculation
- production up to 2020
- sale price constant per dose.
Simple CoG Analysis
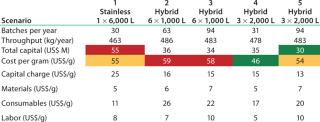
Table 4 shows key results. From a CoG perspective, the results are interesting because scale-out options for the hybrid facility based on the 1,000-L bioreactor (scenarios 2 and 3) are most expensive, followed by the stainless steel and 2,000-L options (scenario 5). The lowest CoG is achieved by running 3 Ă— 2,000-L bioreactors and harvesting all bioreactors together. The 3 Ă— 2,000-L bioreactor scenario shows the lowest consumable cost among the hybrid options. Although consumables are more expensive here than in the stainless case, those costs are more than offset by cost
reductions in other areas, particularly in terms of capital cost. Our scenario analysis confirms the thesis that as you increase the use of disposables, you are moving fixed up-front costs to activity-based costs (you only spend the money when you need to manufacture). This shift in cost structure has implications in terms of the effect of facility use and risk. A detailed discussion of facility use will be the subject of a later article.
Table 4: Scenario capital and CoG
Accounting for Time and Project Risk
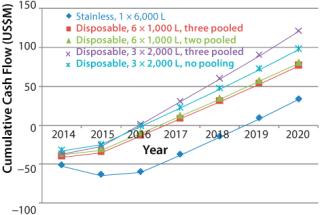
An analysis of the cash spend profile reveals a different perspective In this case, we have taken the capital spend profile for each scenario, factored in manufacturing costs during start up, and taken into account revenue from product sales. Figure 1 shows the outcome and illustrates the significant benefits gained from simpler hybrid facilities, principally that hybrid facilities in all cases will go cash-positive easier than a conventional stainless facility. That result is due to two factors: The stainless steel facility takes longer to build, and it requires more upfront capital. Key benefits of the hybrid approach are
- Hybrid facilities’ break-even point is 2–2.5 years earlier than those of stainless steel.
- Delaying the build by a year reduces risk by committing to build only after a year’s information has been received.
- A hybrid facility has lower capital intensity.
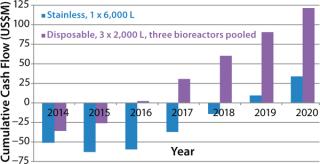
In our case, scenario 4 has the highest cumulative cash flow curve and is again the most attractive of all the options. In Figure 2, the most attractive option is compared with the stainless steel facility.
The next assessment is translating cash flows into project returns. Table 5 shows that scenario 4 is the most attractive option in terms of highest return. It is interesting to note that if we take this approach, then all the hybrid facility options are more attractive than the stainless steel option. That is contrary to the CoG analysis, which does not take into account the time value of money spent. CoG assumes that $1 spent today has the same value as $1 spent 10 years later, which is clearly not the case.
Table 5: Scenario NPV, ROI*, and breakeven
Measuring the Cost of Manufacturing (Project Appraisal)
Cost of goods (CoG) is the most commonly used method for evaluating manufacturing costs. It is not the most rigorous approach, and CoG should not be used when there is a need to understand the interplay among cash flows, expenditures, and project risk.
Some typical methods for evaluating projects are net present value (NPV), return on investment (ROI), and break-even point (the year when the facility begins to make a profit). All provide useful tools for decision-making, particularly for capital investment and project approval. NPV and ROI are particularly popular for evaluating potential long-term projects because they account for the up-front investment required as well as the timing of future cash flows and the risk and/or opportunity cost of a project. The basic calculation for NPV* is

in which “Initial Investment” is the cash invested at the beginning of the project (t = 0), t is the unit of time (measured in years), N is the lifetime of the project in years, Ct is the net cash flow for each year of the project, and r is the discount rate, also referred to as rate of return, interest rate, hurdle rate, or cost of capital.
For NPV calculations, one of the most crucial considerations is the discount rate. The rate at which future cash flows are discounted to represent their present value is generally based on a required rate of return, which for financial planning purposes is typically the rate that would be expected from an investment of comparable risk. When interpreting NPV, the accepted logic is that projects that have positive NPV values will add value to a company and should be undertaken, whereas projects with negative NPV values should be rejected.
Another method of evaluating expected return is ROI, which is useful for various considerations such as short-term projects. In simple terms, ROI is the ratio of money gained or lost as a result of an investment to the money invested. For example, if a $500 million capital investment resulted in an incremental revenue of $150 million and incremental expenses of $100 million in the first year, the return on investment would be ($150 M – $100 M)/$500 M = 10% ROI. ROI may be based on cash flows or net income/loss and may be based on
a single point in time or may account for the present value of gains/losses.
*NPV methodology is the best technique to analyze alternative technologies and manufacturing strategies because it accounts for the impact of delays in expenditures and properly accounts for the time value of money.
Implications
One question that often arises is the advisability of using disposable bioreactors if required cell-culture capacity exceeds that of the largest disposable bioreactor. Taking our particular case, the simple answer based on this analysis is yes, it should be considered as a serious option. Hybrid facilities offer the promise of faster builds and a more attractive cash flow profile than soley stainless-steel facilities. The disadvantages of using multiple bioreactors are more than offset by increased costs when moving to a stainless-steel facility. This assessment is borne out by the ROI and NPV analyses, which take into account the time value of money and project risk. In part, the benefits seen are derived from lower capital spend, and risk reduction derives primarily from the ability to delay spend and move away from up-front investment to activity-based spending on consumables. This move to activity-based spending provides the an opportunity to reduce costs later during the lifecycle of a facility through joint cost-reduction programs with suppliers of materials and consumables.
A final point is that although CoG is a useful tool to assess the merits of a particular process or technology, users must be aware of its limitations. When making strategic decisions associated with new investments, such an analysis needs to include the timings of spend and the relative risk associated with each choice. It is only by carrying out this type of analysis (based on ROI and NPV) that the full economic potential of disposable systems can be understood. Such an approach provides us with the tools to understand and evaluate, capital intensity, the timing of cash flows, and the effect on time taken to bring on-board new capacity.
Author Details
Corresponding author Andrew Sinclair is cofounder and managing director of Biopharm Services, Lancer House, East Street, Chesham HPS 1RD, United Kingdom; 44-14947-932-43, a.sinclair@biopharmservices.com. Miriam Monge is vice president of marketing and disposables implementation at Biopharm Services; m.monge@biopharmservices.com
REFERENCES


