Compared with that for new drugs, biosimilar development faces significantly condensed timelines from cell line to first-in-human (FIH) trials. A biosimilar development program needs to accelerate quickly toward preclinical and phase 1 studies; phase 2 studies typically are not required because dose response and other patient-treatment concepts are already established by the original, comparator medicine. Phase 3 studies typically are limited to fewer patients, which ultimately shortens overall timelines and costs.
The key challenge remains: demonstrating comparability and high similarity based on in-depth analytics as outlined in a number of guidance documents from the European Medicines Agency (EMA), the US Food and Drug Administration (FDA), and the World Health Organization (WHO) (1–3). This often requires multiple iterations during early phase development compared to that for an originator product (4). An integrated approach to cell line development and early stage screening and process development is therefore imperative for making appropriate decisions in pursuing the right candidate for preclinical and clinical manufacturing. Here, we present such an approach for a biosimilar trastuzumab, from cell-line through early phase development with manufacturing-ready titers and clinically relevant product quality attributes.
Our platform begins with development of a high-producing Chinese hamster ovary (CHO) cell line expressing the desired target protein. Although recombinant technologies are extremely powerful tools for expression of biotherapeutics, manufacturing success depends on identifying cell lines that stably produce high protein titers. A critical part of biopharmaceutical development is choosing the right cells for meeting the objective of confirming cell productivities, cell- line stability, and final-product quality. The most common gene expression systems are based on dihydrofolate reductase (DHFR) and glutamine synthetase (GS).
However, identifying suitable cell lines is traditionally a time- consuming, labor-intensive process because their productivity and stability can vary enormously. Several thousands of clones must be screened to find those with both the highest yield and the best product quality traits. To improve cell-line selection and reduce timelines, we developed a stable cell line using the SUREtechnology Platform system from Selexis SA. It is based on DNA- based elements (Selexis Genetic Elements, SGEs) that control the dynamic organization of chromatin within all mammalian cells. They allow for unwinding a transgene’s genomic environment — a prerequisite for efficient gene expression. The SGE approach has been shown to prevent transgene silencing and provide high transcription rates for all copies of the transgene, thus enabling higher and more stable expression of recombinant proteins.
Subsequently, we performed design-of-experiment (DoE) studies using shake flasks to identify base media and feed media strategies, confirming the results at 2-L scale. We further optimized the 2-L process to meet desired product titers and quality. A three-column downstream process was developed to yield high monomer content. We successfully scaled up our process to a pilot-scale setup for both upstream and downstream operations, with comparable process and product attributes. Every step in this process was supported by detailed analyses: e.g., N-glycan analysis to demonstrate comparability and quality, and size-exclusion chromatography (SEC) and capillary isoelectric focusing (cIEF) to confirm quality based on size variants and charge variants. Finally, we have developed a process ready for transfer to manufacturing using chemically defined medium under an aggressive timeline, with a product titer in the range of 3–4 g/L, while meeting product quality attributes comparable to those of the innovator molecule.
Materials and Methods
We adapted a current good manufacturing practice (CGMP) compliant CHO-K1 ATCC derivative host cell line to grow in BalanCD Growth A media, a commercial chemically defined (CD) product from Irvine Scientific. To keep the environment of the cells unchanged throughout the whole procedure, we used the same medium as a basal medium for transfection, single-cell cloning, and production. We incorporated genes encoding the Hc and Lc and selection markers into SUREtech vectors containing SGEs to maintain transcription at the maximum level.
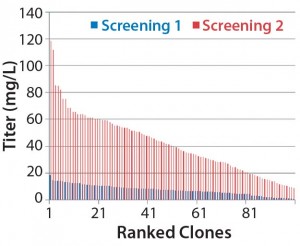
Figure 1a is a schematic of the development process we used to establish the cell line for use in this study. DNA was delivered by electroporation to improve transfection efficiencies. We applied an antibiotic selection to create the stable pools, picking about 100 clones for manual expansion from 96-well to 24- and six-well plates. Based on immunoglobulin G (IgG) titers, we transferred selected clones to shake flasks, then further examined the best performers during a 14-day fed-batch process.

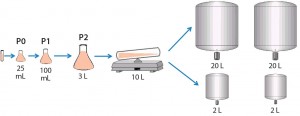
Figure 1a: Cell-line development process used herein, with clone selection in 96-well and expansion to 6-well plates performed manually.
We accomplished those multiple steps of expansion without any antibiotic selection, carefully characterizing and selecting clones for attributes that would be compatible with our production requirements. Finally, we banked and tested 10 qualified clones for cell identity and for endogenous and adventitious microbial contaminants (bacteria, fungi, and mycoplasma). To analyze their expression constructs at the nucleic-acid level (genetic stability), we assessed the constructs by quantitative polymerase chain reaction (qPCR). Finally, we selected a single clone for further process development.
Process Development and Scale-Up
Basal Media Screening and Feed Strategy Development: To evaluate a set of commercially available cell culture media with different feed options, we performed a basal media screening study. To evaluate the media types for both basal and feed media, total feed amount, feed duration, and temperature shift, we performed 14 shake-flask studies with 100-mL working volume (WV). And we subsequently inoculated an additional 12 shake flasks to further optimize feeding strategy.
To monitor those shake flasks for cell growth and viability, we used a Vi-Cell counter from Beckman Coulter; to monitor for metabolites, we used a BioProfile Analyzer instrument from Nova Biomedical. We took titer samples on day 3 and then daily after day 5, finally harvesting the flasks when the cultures reached ~60% viability.
Cell Culture Process Development: To further evaluate and confirm process parameters such as temperature shift, pH, and glucose levels, we ran two sets of four 2-L scale bioreactors, evaluating two different temperature shift conditions (34 °C and 32 °C). Glucose was fed up to 4 g/L when it fell below 3 g/L; pH was controlled using a sodium bicarbonate–carbon dioxide system. The system controlled dissolved oxygen (DO) at a set point of 40% with a fixed air-flow rate and O2 on demand. We defined our feed strategy, total feed amount, and feed duration based on results from our shake-flask studies.
For the seed train, we thawed and passaged cells about every three days. For the last seed-train passage (n – 1) before bioreactor inoculation, we expanded the cells in a Wave bioreactor from GE Healthcare equipped with temperature control. Figure 2 shows this process.
We sampled the culture daily to measure cell density, viability, and metabolite levels. After day 3, we sampled daily for analytical purposes (including titer and quality attributes). Bioreactors were harvested when cultures reached ~60% viability. Using a sterile process, we collected the cell culture contents and centrifuged them before filtering the supernatant through a 0.2-µm Pall Acropak 500 filter. Filtrate was collected and stored in a –80 °C freezer for downstream processing.
| Analytical Abbreviations
CD: Circular dichroism
|
Cell Culture Process Scale-Up to Pilot Scale: To demonstrate scalability, we scaled the 2-L process up to 20 L. We performed several 20-L bioreactor runs using a Sartorius-Stedim BB30 stainless-steel bioreactor. The system maintained scale-independent parameters (pH, pCO2, feed strategy, temperature shift, and so on) as defined in the 2-L bioreactor cell cultures. Scale-dependent parameters were scaled appropriately. We designed the air flow rate to a constant volume per volume per minute (vvm) that translated to 0.15 standard liters per minute (SLPM) with a ring sparger. Agitation rate scale-up was based on constant power per unit volume of fluid (P/V), which translated to 100 rpm.
Downstream Development and Scale-Up: We developed and scaled up a three-column purification process to meet the requirements for our 20-L scale bioreactor run. The downstream process starts with harvest clarification using a POD depth filtration system from EMD Millipore, followed by column operations on a GE Healthcare ÄKTA Pilot system. The protein A capture step used MabSelect SuRe resin from GE Healthcare with phosphate-buffered saline (PBS) equilibration followed by loading and washing with PBS. After a secondary wash with PBS and 1 M sodium chloride, we ran a final wash with PBS before eluting the protein with 50 mM sodium acetate at pH 3.4.
After a viral inactivation step, we titrated the pool to pH 5.0. Next, cation exchange (CEX) chromatography in bind–elute mode used POROS XS media from Life Technologies, with equilibration using 50 mM sodium acetate followed by a 4-CV wash at pH 5.0. We used a gradient elution with sodium chloride from 75 to 270 mM over 20 CV. Then a polishing anion-exchange (AEX) chromatography used POROS HQ resin (also from Life Technologies) in flow-through mode, with a 3-CV chase at pH 7.8–8.0. Finally, we processed the eluate through a Virosart CPV virus filter followed by an ultrafiltration/ diafiltration (UF/DF) operation in an ÄKTA Crossflow system from GE Healthcare.
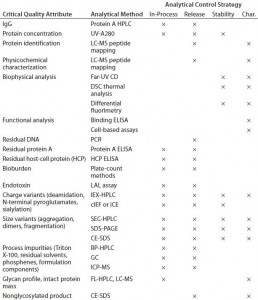
Analytical Development: Table 1 shows a typical analytical strategy during early development. For the current proof-of-concept study, we considered a subset of those methods as presented below.
Results
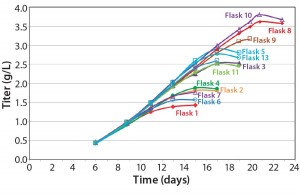
We made research cell banks (RCBs) from the single clone we had selected. Figure 4 shows our initial shake-flask media screening results. Those results helped us identify basal media (Media A) and feed media (Feed B) with a temperature shift (TS) to provide the best performance in terms of viable cell density (VCD) and viability over the duration of the runs.
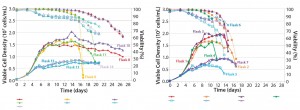
Figure 4: Media screening with temperature shift (left); media screening with no temperature shift (right)
Our feed-strategy optimization results (Figure 5) indicate a nonlinear relationship between total feed percentage and titer. Higher total feed percentages seem to be beneficial up to 16–20%; beyond that point, however, additional feed did not increase titer significantly. Based on statistical analysis using JMP software from SAS Institute, daily feeds from days 3 to 18 gave the best titer results.
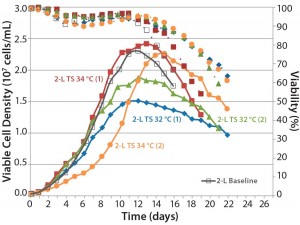
Figure 6: Comparing the effects of temperature shift (TS) to 32 °C and 34 °C from 37 °C on viable cell density, cell viability, and expression titer
A temperature-shift study using 2-L bioreactors showed that the 34 °C condition helped cultures reach higher VCDs, but that viability declines more sharply and earlier than it does at 32 °C. Results are consistent between duplicates, although a shift in growth rate was observed in one run (Figure 6). Based on protein A HPLC titer measurements, cell culture performance was slightly higher for a TS to 32 °C than it was for a TS to 34 °C.
We studied the combined effects of pH dead-band and glucose control to establish a baseline 2-L process that we labeled as the “golden batch.” Maintaining pH above 6.8 led to higher cell growth rates and higher peak VCDs, but viability dropped to 60% or less sooner. By contrast, maintaining pH >6.6 results in cell cultures with lower peak VCD but extended longevity of viability >60%. To achieve higher cell densities while ensuring extended longevity, we set the pH dead band to 6.8–7.2 and based our TS criteria on reaching a cell density of 1 × 10⁶ cells/mL. And to minimize base consumption for pH control, we increased the post-TS pH dead band to 6.6–7.2.
Cultures controlled at lower glucose levels (around 1 g/L) had lower VCDs than those topped at 4 g/L under the same pH conditions. So we decided to maintain the glucose levels at 4 g/L.
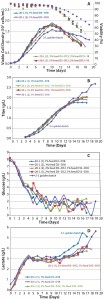
Figure 7: Cell culture process scale-up; (a) viable cell density and viability, (b) titer, (c) glucose profile, and (d) lactate profile
Process Scale-Up Results: As Figure 7 shows, metabolic profiles for the process at 20-L scale compare favorably with those at 2-L scale, although 20-L expression titers flatten out at about 2 g/L whereas viability of the 2-L process declines slower, so titer continues to go beyond 2.5 g/L.
We hypothesized that increased mixing speed (P/V) and slower additions of feed media and glucose might be required to reduce variability in control of pH, feed, and glucose control. To test our hypothesis, we tried slow and bolus feed media and glucose additions coupled with increased agitation rate. As part of scale-up confirmation, we ran additional 2-L cultures in parallel with the same increased agitation to correspond to a constant P/V and similar feed addition schemes.
As the data show in Figure 8, in all cases the peak cell density was higher than it had been in previous runs, and titer in one of the 20-L runs reached 3.35 g/L. Although the second 20-L run continued on a similar track, a viability drop led us to harvest the reactor early in that case. One key noticeable feature in these runs is the dramatic influence on lactate profile of the controlled- feeding strategy in later stages of culture, in which the metabolism shifted to lactate consumption.
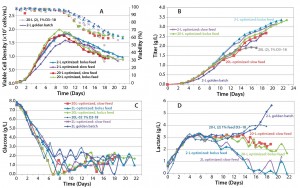
Figure 8: Cell culture process optimized scale-up; (a) VCD and viability, (b) titer, (c) glucose profile, and (d) lactate profile
We evaluated product quality using size-exclusion high- performance liquid chromatography (SEC-HPLC) for size variants, capillary isoelectric focusing (cIEF) for charge variants, and N-glycan analysis for glycosylation profiles. Although purity was 99.8% after three column steps, at the end of the UF/DF step an overall purity of 99.1% monomer and host-cell protein (HCP) <0.05 ng/mg were reached with an overall product yield of 77%.
As measured by SEC-HPLC, the biosimilar purity is comparable with that of the innovator molecule. Additional product attributes — such as the cIEF charge-variant profiles — are also comparable (Figure 9).

Figure 9: Purity measured by size-exclusion high-performance liquid chromatography (SEC-HPLC) and charge variants measured by capillary isoelectric focusing (cIEF) from Cook Pharmica’s 20-L run compared with the innovator molecule
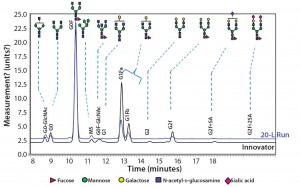
Figure 10: Comparing N-glycans released from the innovator product (black) and Cook Pharmica’s 20-L run (blue)
Because our monoclonal antibody (MAb) molecule is a biosimilar product, its N-glycan profile is an important critical quality attribute (CQA) for the design space according to the quality by design (QbD) paradigm. Figure 10 shows the results of our comparison of N-glycans released from the innovator product (black) and Cook Pharmica’s 20-L run product. Clearly, the glycoforms present in the innovator’s molecule are also present in the material we produced. That glycosylation profile is reproducible and consistent across multiple runs.
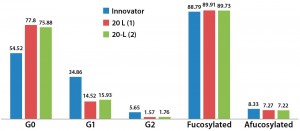
Figure 11: Relative glycoform content from two different 20-L bioreactor runs; afucosylated and fucosylated glycoforms are comparable for both innovator and 20-L bioreactor runs.
Relative afucosylation content in both products is also comparable (Figure 11). This is another important CQA for a MAb such as trastuzumab, which has bioactivity based on its binding affinity toward FcÎł receptors on effector cells and clearance of target cells through antibody-dependent cell-mediated cytotoxicity (ADCC) activity. However, fewer end-capped galactosylated glycoforms appear to be present in the biosimilar, and G0 appears to be relatively more abundant than it is in the innovator. Further iterative developments are ongoing to improve comparability and similarity through the use of different culture media supplements. Additional characterization of the innovator molecule is also required to help us understand lot-to-lot variability of our biosimilar MAb.
A Successful Platform
We have demonstrated an integrated cell-line development effort with process development and scale-up as a successful model for expediting early phase development for biosimilar antibodies. Our approach did not compromise on the scientifically systematic DoE-based approach, but it took a targeted set of experimental studies to meet the requirements of product quality as well as process scale-up needs. This approach was successfully demonstrated using a biosimilar Trastuzumab as a model molecule, with scale-up from 2-L bench scale through a 20-L pilot scale process that will be scalable to larger GMP operations for clinical production.
References
1 CBER/CDER. Guidance for Industry: Scientific Considerations in Demonstrating Biosimilarity to a Reference Product. US Food and Drug Administration: Rockville, MD, February 2012; www.fda.gov/downloads/ drugs/ guidancecomplianceregulatoryinformation/ guidances/UCM291128.pdf.
2 EMEA/CHMP/BMWP/42832/2005. Guideline on Similar Biological Medicinal Products Containing Biotechnology-Derived Proteins As Active Substance: Non-clinical and Clinical Issues. European Medicines Agency: London, UK, 2006; www.ema.europa.eu/docs/ en_GB/document_library/Scientific_ guideline/2009/09/WC500003920.pdf.
3 Guidelines on Evaluation of Similar Biotherapeutic Products. World Health Organization: Geneva, Switzerland, October 2009; www.who.int/biologicals/publications/trs/areas/biological_therapeutics/BS2110Dft_ guidelines_Final_HK_IK_29July_09.pdf.
4 Zelenetz AD, et al. NCCN Biosimilars White Paper: Regulatory, Scientific, and Patient Safety Perspectives. J. Natl. Compr. Canc. Netw. 9, 2011: S1–S22.
Corresponding author Kumar Dhanasekharan (Kumar.Dhanasekharan@ cookpharmica.com) is director of process development; Claudia Berdugo-Davis is a senior scientist, and Xiaoming Liu is an associate scientist in cell culture; Carl Richey and Zaneer Segu are senior scientists in biologics process development and innovation; and Victor Vinci is chief scientific officer and vice president at Cook Pharmica, 1300 South Patterson Drive, Bloomington, IN 47402. David Calabrese is director of cell line services, Valerie LeFourn is head of cell culture, and Pierre- Alain Girod is chief scientific officer at Selexis SA, 18 Chemin des Aulx, 1228 Plan- les-Ouates, Switzerland.

