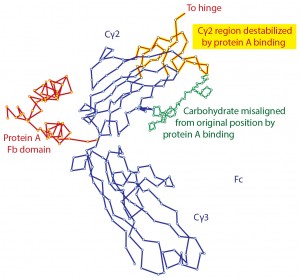
Figure 1: Denaturation of IgG by contact with protein A as shown by X-ray crystallography; modified from (11, 12)
Affinity chromatography with protein A has become the foundation for purification of nearly every therapeutic IgG in commercial production. One of the features most responsible for its success has been its compelling simplicity. IgG binds. Contaminants do not. Load, wash, and elute pure IgG. In the real world, however, protein A does not elute pure IgG. It typically contains several hundred to a few thousand parts per million (ppm) contamination by host-cell proteins (HCPs) and other contaminants.
Numerous studies demonstrate why the biospecificity of protein A fails to deliver the purity it should be capable of. Contributing factors include phenomena such as nonspecific interactions between host contaminants and the base matrix of the chromatography media (1–3), nonspecific interactions between host contaminants and the protein A ligand (3–5), and nonspecific interactions between host contaminants and IgG itself (4–6). Other studies attempt to explain how protein A creates aggregates; for example, by exposure of IgG to low pH during elution (2, 7–10). Yet others suggest that protein A does not promote aggregate formation (1).
These many perspectives and discrepancies highlight that IgG purification with protein A is not as simple as it is often portrayed. These complexities also pertain directly to important product quality attributes, to the task of developing effective purification procedures, and to the potential for improvements in product quality and manufacturing economics. The implication is that a more detailed understanding of protein A could lead to its more effective use.
This article addresses some issues that have not been widely considered: the interactions of protein A with IgG, analysis of IgG under elution conditions, and the role of chromatin. It identifies important new cautionary points, and it reveals practical opportunities for major improvements in purification performance.
The Interaction of Protein A and IgG
Affinity chromatography with protein A is generally assumed to be a benign process. Native IgG goes in, and native IgG comes out — or at least it appears to be native by the time it has been neutralized. However, it has been known for more than 35 years that residence of protein A in its primary binding site at the juncture of the Cγ2 and Cγ3 domains of the Fc region modifies the conformation of IgG (11, 12). It denatures the upper third of the Cγ2 domain and adjacent hinge and carbohydrate structures to such an extent that X-ray crystallography cannot identify definite crystal coordinates for the alpha carbon atoms (Figure 1).
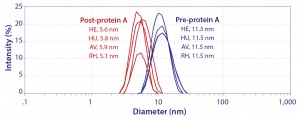
Figure 2: Hydrodynamic diameter of IgG by dynamic light scattering; HE, HU, and AV are prospective biosimilars for Herceptin, Humira, and Avastin. RH is a noncommercial IgG1 monoclonal antibody.
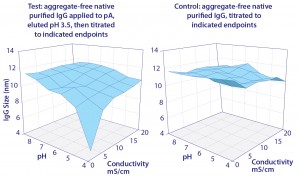
There is no standard for extrapolating chromatographic behavior from protein interactions constrained within a crystal lattice, but it seems evident that similar denaturation must also occur during protein A chromatography. It also seems logical that low pH elution might compound the effect, and recent experimental evidence confirms it. Figure 2 shows that the hydrodynamic diameter of IgG immediately after elution, still in elution buffer, was less than half the diameter of the native molecule: ~5.5Â nm versus ~11.5 nm (13). This occurred with prospective biosimilar Herceptin, Avastin, and Humira formulations, so it seems likely to occur with all IgG antibodies.
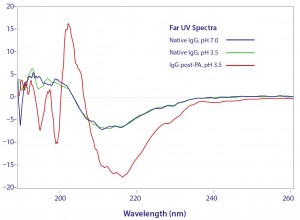
Circular dichroism spectroscopy showed a parallel loss of structure (Figure 3). β-sheet content was reduced by 45%, whereas α-helix increased about 55% (13). Most of the structural impact was localized to the Cγ2 domain. Older conformational studies with rabbit IgG indicate that the Fab region folds over the Fc region at pH 2.0–2.5 (14, 15), and it seems likely that this model also applies to IgG eluted from protein A. Subsequent addition of NaCl or titration to higher pH gradually increased eluted antibody size, and physiological conditions restored native size (Figure 4) (13). After restoration, retitration to pH 3.5 did not alter antibody size.
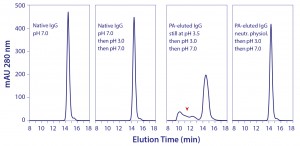
Remarkably, even after seven days in 100 mM acetate, pH 3.5, aggregate content of the neutralized protein A–eluted IgG contained only 0.1% aggregates, the same amount as in the purified IgG loaded onto the protein A column (13). These results suggested that protein A–mediated denaturation did not itself produce aggregation, but they should not be understood to indicate that the reduced-size conformation was inherently stable. Further experiments showed that it was more vulnerable than native IgG to aggregation from additional stress. When the eluted IgG still at pH 3.5 was titrated to pH 3.0 and then neutralized, nearly a third of the antibody became aggregated (Figure 5). Titrating purified native IgG to pH 3.0 and then neutralizing created no additional aggregates.
Chromatin Interactions with Protein A
Recent studies also show that one particular class of host contaminants interacts very strongly with protein A — more strongly even than IgG (5). That class is chromatin, the genetic wreckage remaining after cell death. Its basic subunit is a nucleosome, comprising a core octamer of histone proteins wrapped by 1.65 turns of DNA (~147 bp). The dimensions of a single nucleosome are 11.5 × 5.5 nm, with a combined DNA-histone mass of about 200 kDa. Individual nucleosomes are linked in linear arrays by connecting sequences of DNA.
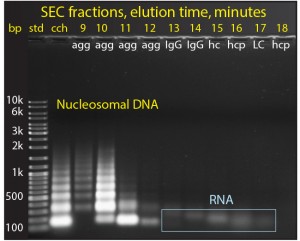
Chromatin in cell culture harvest exists in the form of heteroaggregates. These consist of nucleosomal array cores (DNA plus histone HCP) noncovalently associated with other host-cell contaminants, including RNA, nonhistone host-cell proteins, media components, IgG fragments and misfolds (5, 16). Figure 6 shows agarose electrophoresis of cell culture harvest fractionated by size-exclusion chromatography (SEC). The nucleosomal origin of the aggregate fraction is clearly evident. The smallest band represents a single nucleosome with about 150 bp of DNA. Larger bands represent arrays containing larger numbers of nucleosomes: multiples of 150 bp plus the linking DNA segments. The largest SEC aggregates contain the largest nucleosomal arrays, and later- eluting aggregates contain progressively smaller arrays.
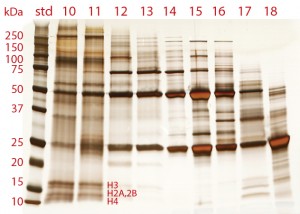
Polyacrylamide gel electrophoresis (PAGE) highlights both the histone and nonhistone HCP components of chromatin heteroaggregates (Figure 7). One of the most interesting features is the diversity of protein species in the aggregate fractions — more than all of the other fractions combined. This highlights the ability of nucleosomal arrays to associate noncovalently with a broad diversity of protein species, and it is not surprising that they should do so. DNA is exposed along the perimeter of nucleosomes. Negatively charged oxygen atoms at each phosphate residue endow it with a strong cation-exchange functionality. Histones are exposed at the top and bottom of each nucleosome. They are highly alkaline and hydrophobic. Also, both histones and DNA are documented to participate in metal affinity, hydrogen bonding, and van der Waals interactions (17–20).
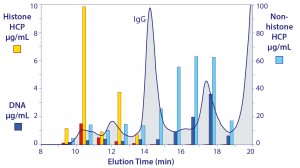
Figure 8: The native size distribution of host contaminants in cell culture harvest; note the difference in scales between the vertical axes.
Figure 8 illustrates the native size distribution of host contaminants in cell culture harvest. Again, the distribution of nonhistone HCP is one of the most interesting features, because it constitutes the dominant proportion of heteroaggregate mass, generally five to seven times greater than the nucleosomal array cores it is associated with (note the different scales on the vertical axes) (5, 16). Dynamic light scattering shows that heteroaggregate size ranges from 50 to 400 nm. Occupants of the upper end of the range are understood to represent compound associations among smaller heteroaggregates.
A histone-enriched subset comprising 5–20% of total chromatin heteroaggregates binds strongly to protein A. Histones are a good multimodel match to acidic-hydrophobic protein A, but this raises the question: Why don’t all histone- containing heteroaggregates bind protein A? The answer seems to be that only heteroaggregates with a sufficient complement of histones on their surface are able to bind (5, 16).
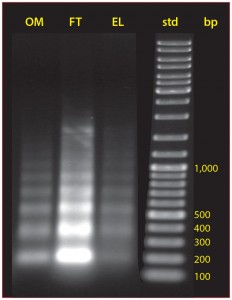
Figure 9: The size distribution of nucleosomal arrays in cell culture, protein A flow-through, and the IgG fraction eluted from protein A
Chromatin heteroagregates are mostly too large to enter the pores of protein A chromatography particles. This causes them to accumulate on the particle surfaces, where they block access to IgG, interfering with its diffusion into the pores. This explains why chromatin heteroaggregates reduce binding capacity for IgG by up to 20% (5, 16).
Chromatin heteroaggregates are destabilized by the low pH conditions used to elute protein A. This causes contaminant subsets to leach into the IgG fraction, where they constitute 99% of host contaminants (5). This is distinct from coelution, which would involve contaminants being dissociated from direct associations with protein A. The leached subset includes intact chromatin heteroaggregates, apparently dissociated from compound associations accumulated on the protein A during loading. This is shown by the distribution of nucleosomal DNA in the elution fraction largely matching the distribution in the feed stream (Figure 9).
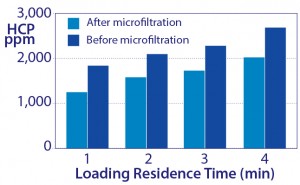
Figure 10: Increased host-protein contamination as a result of increasing sample residence time to increase capacity
Leaching from strongly bound chromatin heteroaggregates mediates another unexpected outcome. The common practice of increasing sample residence time to maximize IgG binding capacity causes greater accumulation of chromatin heteroaggregates, producing a larger leachate reservoir, which translates into more leaching and higher HCP contamination (Figure 10).
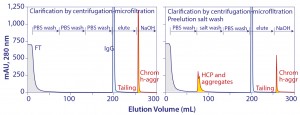
Figure 11: Protein A chromatograms showing that a large accumulation chromatin heteroaggregates remain bound after elution and showing that aggressive preelution washes work by preleaching contaminant subsets from chromatin elements that remain bound
Studies going back to the 1990s recommend aggressive pre-elution washes to reduce host contamination in protein A–eluted IgG (2, 3). Recent work shows that such washes work by preleaching a portion of the chromatin heteroaggregates that would otherwise leach during elution (Figure 11) (5). As shown, a significant population of chromatin heteroaggregates remains associated with protein A after elution. Much of it can be removed by 3–4 M guanidine. 50 mM NaOH is more effective, but 500 mM is required to remove it completely (5).
These results collectively highlight one of the most important practical features of chromatin heteroaggregates in downstream processing: They comprise a system for smuggling host contaminants through purification steps. DNA is a case in point. Purified
DNA does not bind protein A because both molecules have the same charge; they repel each other (5). DNA exists in protein A-eluted IgG only because protein A binds chromatin heteroaggregates, and DNA-containing subsets of those heteroaggregates leach from elements that remain bound during elution. The importance of this phenomenon
cannot be overstated. Chromatin heteroaggregates cause hundreds of contaminant species with no affinity to protein A to be bound indirectly. Then leaching imposes them on the next purification step. This is a very serious issue because it erodes the fundamental regulatory concept of orthogonal process design.
These results further highlight a more important, more basic lesson: Â Contaminant species do not exist solely as independent entities in cell culture harvests, and they do not behave solely as independent entities. DNA tends to be conceptualized as a chemically defined independent entity floating freely in the supernatant, but this probably never occurs. Experimental evidence shows that DNA is always associated with histones or other proteins and peptides that strongly influence its apparent size, chemical interactivity, and the effectiveness of various purification methods to remove it. Again, the same principle extends to other host contaminants.
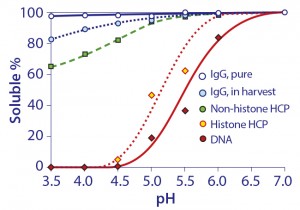
Figure 12: Relative solubilities of purified IgG in buffer and unpurified IgG in cell harvest as a function of pH
IgG Interactions with Chromatin
There are no direct indications that IgG has a significant affinity for chromatin heteroaggregates or other host contaminants under physiological conditions. That changes at acidic pH, which has important ramifications for protein A chromatography. Figure 12 compares the solubility of purified IgG in buffer, with solubility of IgG, DNA, histone, and nonhistone proteins in cell culture harvest. Purified IgG in buffer was weakly insoluble at pH 3.5, which suggested a tendency to self-associate under protein A elution conditions (20, 21).
IgG solubility in cell culture harvest at pH 3.5 was only 82%. DNA and histones were precipitated. The lower solubility of IgG was interpreted to indicate its adsorption to precipitated chromatin. This is important because it predicts a strong interaction between IgG and the chromatin heteroaggregates that bind to protein A — not during binding or washing, but during elution.
Inside a protein A column, eluting IgG has access to two different subsets of chromatin heteroaggregates: the subset that leaches during elution and the subset that remains bound during elution. Eluted IgG adsorbing to the bound subset is lost. It does not elute and is not encountered again until the column is cleaned with an agent that displaces chromatin heteroaggregates. This is the main reason why IgG recovery from protein A columns loaded with harvest clarified only by centrifugation and microfiltration is sometimes as low as 90% and rarely above 95%. Recovery of purified IgG loaded to a protein A column is typically at least 99%.
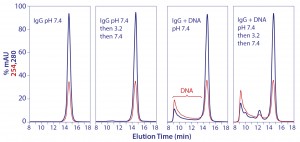
Interactions between eluted IgG and the chromatin leachates that accompany them create aggregates that persist after neutralization (17). Figure 13 shows that DNA plays a particular role in this process. Although not expected, neither is it surprising. As a virtual cation exchanger, DNA must be understood to interact strongly with IgG at pH 3.5. Guo et al. have recently shown that the interaction of IgG with a cation exchanger creates an unstable intermediate conformation (22, 23). In essence, the cation exchanger acts as a template to create a conformation that would not occur with IgG in free solution. When released back to free solution, the templated variant cannot spontaneously regain its native conformation. The interaction between IgG and nucleosomal DNA in protein A–eluted IgG is likely to be an example of the same phenomenon.
Given that low pH tends to dissociate chromatin heteroaggregates, it should not be surprising that raising the pH of the eluted IgG promotes their reassociation. They form large particles that create the high turbidity commonly observed upon neutralization of eluted IgG. IgG that was associated with leached chromatin elements under elution conditions meanwhile becomes dissociated from them (20).
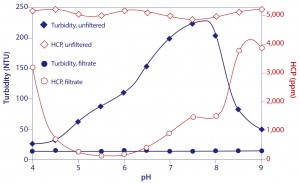
Figure 14: Turbidity and host protein content of protein A-eluted IgG titrated to different pH endpoints
This combination of events makes it possible to remove the particle- associated contaminants from the IgG by simple microfiltration. The improvement in host contamination can be more than 100-fold for HCP (Figure 14), and more than 1,000-fold for DNA. A pH of 5.5 supports the best results (20, 21), but only in the absence of excess salts or arginine, both of which cancel the benefit. NaCl and arginine also reduce IgG recovery (13), providing yet further reason to leave them out of elution buffers.
Full restoration of IgG to its native size requires exposure to physiological conditions (13). After that, reexposure to low pH has no effect on antibody size. This reaffirms that creation of the reduced-size conformation during elution requires the involvement of protein A. The “Protein A in the Real World” box consolidates the new findings with previous knowledge of how the technique works.
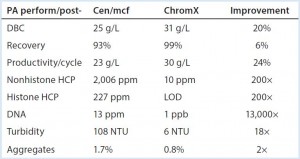
Table 1: Performance summary, protein A with and without advance removal of chromatin heteroaggregates; DBC (dynamic binding capacity), 5% breakthrough, two-minute residence time. All data are from a prospective Herceptin biosimilar on Toyopearl AF rProtein A-650F. Cen/ mcf (centrifugation-microfiltration), ChromX, and chromatin extraction are as described in (5). NTU (nephelometric turbidity units) after titration to pH 6.5. LOD, are below limit of detection.
Productivity Improvements
One of the most obvious conclusions of these findings is that protein A would work a lot better if chromatin was absent from the feed stream to begin with. Methods for advance extraction of chromatin have been discussed in recent publications (5, 16, 20), and they support the predicted benefits (Table 1). They also enable dramatically better results than from the application of aggressive pre- elution washes (5).
Another obvious conclusion from Table 1 is that if you can obtain IgG with less than 10 ppm HCP and 1Â ppb DNA directly from protein A, final polishing can be reduced to a single step without compromising performance. Proposals of step- reduction always raise the question of adequacy of virus reduction, but this highlights another benefit of advance chromatin extraction: It reduces nonenveloped virus by up to 5 logs and enveloped virus up to 9 logs (5, 16).
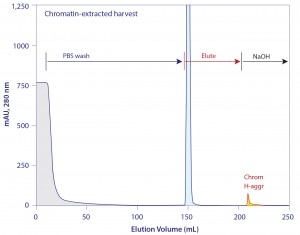
Figure 15 illustrates the elution profile from protein A loaded with chromatin-extracted harvest. As expected, the NaOH cleaning peak is dramatically smaller than when the column is loaded with chromatin- containing harvest (Figure 11). Sanitization with 50 mM NaOH leaves protein A loaded with chromatin-extracted harvest cleaner than 100 mM NaOH treatment of protein A loaded with nonextracted harvest. This suggests a high probability that protein A loaded with extracted harvest can support a larger number of cleaning cycles.
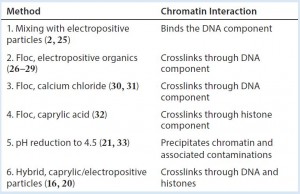
Although an understanding of chromatin’s role in downstream processing is just beginning to emerge, sample preparation methods have been unknowingly exploiting the chemistry of chromatin for decades. Knowledge of chromatin’s involvement now reveals why a diversity of chemical approaches often produce similar effects (Table 2). The revelation of chromatin as the focal element should now hasten optimization of products to manage it and make effective chromatin management widely available to process developers and manufacturers of therapeutic antibodies.
| Protein A in the Real World |
| 0. Clarified cell culture harvest under physiological conditions. Interactions between nonaggregated IgG and chromatin heteroaggregates are nil at this point. |
| 1. Load. IgG becomes denatured on contact with protein A. More than 80% of chromatin heteroaggregates meanwhile flow through the column. The other 20% bind to the external particle surfaces of the media, block IgG access, and reduce binding capacity up to 20%. The bound heteroaggregates provide a leachate reservoir that causes multiple problems during elution. |
| 2. Wash. Physiological buffers displace unbound contaminants, but many contaminants are associated with chromatin heteroaggregates bound to protein A. Optional washing with aggressive buffers such as containing high NaCl, arginine, urea, organic solvents, surfactants, low pH, and high pH dissociates some associations within heteroaggregates and allows the dissociated elements to be washed away, leaving a lesser amount to be dissociated during the elution. |
| 3. Elute. Low pH creates a “perfect storm.” It compounds protein A-mediated denaturation of IgG and releases it from protein A. It promotes formation of stable nonspecific associations between IgG and chromatin heteroaggregates. It causes dissociation of some contaminant subsets from chromatin heteroaggregates, but other elements remain bound to protein A. IgG that becomes associated with still-bound chromatin is lost, typically about 5%. IgG that becomes associated with dissociated chromatin elements becomes aggregated. 99% of the host contaminants in the IgG fraction are dissociated from chromatin heteroaggregates. The presence of NaCl severely reduces IgG recovery, arginine slightly, but both enhance leaching from chromatin heteroaggregates and inflate host contamination of the eluted IgG. |
| 4. Preneutralize. Preneutralization to pH 5.5 dissociates IgG from its low-pH associations with chromatin heteroaggregate elements and causes those chromatin elements to reassociate into large heteroaggregate particles that can be removed by microfiltration. The filtrate typically contains at least 100-fold lower host contamination. This works only in the absence of salt or arginine. |
| 5. Neutralize. Restoration of physiological conditions restores IgG to native size. |
| 6. Cleaning and Sanitization. 50–100 mM NaOH removes the majority of chromatin aggregates still bound to protein A after elution of IgG. IgG lost by association with protein A-bound chromatin during elution is found in this fraction. |
References
1 Vunnum S, Vedantham G, Hubbard B. Protein A–Based Affinity Chromatography: Process Scale Purification of Antibodies. Gottschalk U, Ed. J. Wiley and Sons: Hoboken, NJ, 2009; 79–102.
2 Gagnon P. Purification Tools for Monoclonal Antibodies. Validated Biosystems, Tucson: 155–197; www.validated.com/books/ ptmabs.html.
3 Shukla A, Hinckley P. Host-Cell Protein Clearance During Protein A Chromatography: Development of an Improved Column Wash Step. Biotechnol. Prog. 24(5) 2008: 1115–1121.
4 Nogal B, Chiba K, Emery J. Select Host-Cell Proteins Coelute with Monoclonal Antibodies in Protein A Chromatography. Biotechnol. Prog. 28(2) 2012: 454–458.
5 Gagnon P, et al. Nonspecific Interactions of Chromatin with Immunoglobulin G and Protein A, and Their Impact on Purification Performance. J. Chromatogr., A 1340 (May 2014): 68–78.
6 Björck I, Åkerstöm B. Bacterial Immunoglobulin-Binding Proteins, Vol. 1. Boyle M, Ed. Academic Press: San Diego, CA; 113.
7 Arakawa T. et al. Elution of Antibodies from a Protein-A Column by Aqueous Arginine Solutions. Protein Expression Purif. 36(2) 2004: 244–248.
8 Ejima D., et al. Effective Elution of Antibodies By Arginine and Arginine Derivatives in Affinity Column Chromatography. Anal. Biochem. 345(2) 2005: 250–257.
9 Sneider C, Trout B. Investigation of Cosolute-Protein Preferential Interaction Coefficients: New Insight into the Mechanism By Which Arginine Inhibits Aggregation. J. Phys. Chem. B 113(7) 2009: 2050–2058.
10 Shukla F, Trout B. Interaction of Arginine with Proteins and the Mechanism By Which It Inhibits Aggregation. J. Phys. Chem. B 114(42) 2010: 13426–13438.
11 Deisenhofer J. Crystallographic Refinement and Atomic Models of a Human Fc Fragment and Its Complex with Fragment B of Protein A from Staphylococcus Aureus at 2.9 and 2.8° A Resolution. Biochemistry 20(9) 1981: 2361–2370.
12 Deisenhofer J, et al. Crystallization, Crystal Structure Analysis and Atomic Model of the Complex Formed By a Human Fc Fragment and Fragment B of Protein A from Staphylococcus Aureus. Hoppe-Seylars Z Physiol. Chem. 359(8): 975–985.
13 Gagnon P, et al. Transient Conformational Modification of Immunoglobulin G During Purification By Protein A Affinity Chromatography. J. Chromatogr., A 1395 (May 2015): 136–142.
14 Buchner J, et al. Alternatively Folded States of an Immunoglobulin. Biochemistry 30(28) 1991: 6922–6929.
15 Martsev S, et al. Thermodynamic and Functional Characterization of a Stable Conformer Obtained By Renaturation from a Partially Structured Low pH-Induced State. FEBS Lett. 361(2–3) 1995: 173–175.
16 Gagnon P, et al. Chromatin-Mediated Depression of Fractionation Performance on Electronegative Multimodal Chromatography Media, Its Prevention, and Ramifications for Purification of Immunoglobulin G. J. Chromatogr., A 1374 (December 2014): 145– 155.
17 Luscombe N, Laskowski R, Thornton J. Amino Acid–Base Interactions: A Three- Dimensional Analysis of Protein–DNA Interactions at an Atomic Level. Nucleic Acids Res. 29(13) 2001: 2860–2874.
18 Privalov P, Dragan A, Crane-Robinson C. Interpreting Protein/DNA Interactions: Distinguishing Specific from Non-Specific and Electrostatic from Non-Electrostatic Components. Nucleic Acids Res. 39(7) 2011: 2483–2491.
19 Thomas J, Butler P. Characterization of the Octamer of Histones Free in Solution. J. Mol. Biol. 116(4) 1977: 769–781.
20 Gagnon P, et al. Non-Immunospecific Association of Immunoglobulin G with Chromatin During Elution from Protein A Inflates Host Contamination, Aggregate Content, and Antibody Loss. J. Chromatogr., A 1408 (August 2015): 151–160.
21 Chollangi S, et al. Development of Robust Antibody Purification By Optimizing Protein-A Chromatography in Combination with Precipitation Methodologies. Biotechnol. Bioeng. July 2015: Doi: 10.1002/bit.25639.
22 Luger K, Richmond T. DNA Binding within the Nucleosome Core. Curr. Opin. Struct. Biol. 8(1) 1998: 33–40.
23 Guo J, Zhang S, Carta G. Unfolding and Aggregation of a Glycosylated Monoclonal Antibody on a Cation Exchange Column, Part 1: Chromatographic Elution and Batch Adsorption Behaviour. J. Chromatogr., A 1356 (August 2014): 117–128.
24 J. Guo, G. Carta, Unfolding and Aggregation of a Glycosylated Monoclonal Antibody on a Cation Exchange Column, Part 2: Protein Structure Effects By Hydrogen Deuterium Exchange Mass Spectrometry. J. Chromatogr. A 1356 (August 2014): 129–137.
25 Schirmer E, et al. Primary Clarification of Very High Density Cell Culture Harvests By Enhanced Cell Settling. BioProcess Int., 8(1) 2010: 32–39.
26 Kang Y, et al. Development of a Novel and Efficient Cell Culture Flocculation Process Using a Stimulus Responsive Polymer to Streamline Antibody Purification Processes. Biotechnol. Bioeng. 110(11) 2013: 2928–2937.
27 Shan J, et al. Flocculation of Cell, Cell Debris, and Soluble Proteins with Methacryloyloxyethyl Trimethylammonium Chloride–Acrylonitrile Copolymer. J. Biotechnol. 49(1–3) 1996: 173–178.
28 McNerny T, et al. PDADMAC Flocculation of CHO cells: A Centrifuge- Less Harvest Process for MAbs. 241st ACS National Meeting, Anaheim, CA (2011).
29 Riske F, et al. The Use of Chitosan As a Flocculant in Mammalian Cell Culture Dramatically Improves Clarification Throughput Without Adversely Affecting Monoclonal Antibody Recovery. J. Biotechnol. 128(4) 2007: 813–823.
30 Tobler S, et al. Analysis of Protein A Peak Precipitates and Approaches to Reduce Peak Turbidity. Poster presented at the 232nd ACS National Meeting, San Francisco, CA (2006).
31 Spritzer R, et al. Calcium Phosphate Flocculation of an Antibody-Producing Mammalian Cells at Pilot Scale. 232nd ACS National Meeting, San Francisco, CA (2006).
32 Brodsky Y, et al. Caprylic Acid Precipitation Method for Impurity Reduction: An Alternative to Conventional Chromaotgraphy for Monoclonal Antibody Purification. Biotechnol. Bioeng. 109(10) 2012: 2589–2598.
33 Lydersen B, et al. Acid Precipitation of Mammalian Cell Fermentation Broth. Ann. NY Acad. Sci. 745 (November 1994: 222–231.
Pete Gagnon is manager, and Rui  Nian is a research scientist in the downstream processing group at the Bioprocessing Technology Institute, Singapore; pete_ gagnon@bti.a-star.edu.sg.

