Antibody fragments are potent active drug substances (1–4). Because they lack glycosylation, they can be produced using different biological expression systems, including yeast and microbial systems as well as mammalian cells. These molecules are interesting as biopharmaceuticals because they are smaller than full-size antibodies and therefore may penetrate better into different tissues.
Antibody fragments are cleared faster in biological systems because they lack the Fc antibody structural region (4). However, fragments may be conjugated to increase their size for improved pharmacokinetics, for example using polyethylene glycol (PEG). Certolizumab pegol, a PEGylated IgG Fab fragment, has been on the market since 2008 (4), and many other such products are in clinical trials. Engineered antibody fragments such as scFv, scFab, diabodies, and divalent fragments (DiFabodies) also are under investigation (1–3). Fragments lack disulfide-bonds, a preferable condition for prokaryotic production cell lines.
Affinity chromatography materials are commercially available for fragment capture, but they are expensive and susceptible to degradation during column cleaning. Moreover, in traditional batch chromatography, affinity resins often are not used according to their full capacity because of mass-transfer limitations that lead to shallow breakthrough curves and low dynamic capacities. The affinity resin used in our study — GE Healthcare’s Capto L medium — binds to the kappa-light chain of Fab fragments on IgGs. It can capture several fragment types, including the F(ab′)2 fragment used in this study. Capto L resin uses immobilized camelid antibodies. Such stationary phases for antibody- fragment capture have much lower binding capacities than modern protein A affinity resins used for monoclonal antibody (MAb) capture, with decreased caustic stability and higher cost.
The Technology
ChromaCon AG’s CaptureSMB process is a twin-column, countercurrent chromatographic capture technology that has been shown to make better use of protein A resin capacity than traditional batch chromatography. Based on mass of product ÷ (volume of resin used × time), it improves productivity for full-size IgG-type MAbs (5). Hence, resin costs (or optionally, processing time) can be decreased, product concentrations are increased, and buffer consumption is lowered.
Figure 1 shows a schematic description of this process. It comprises batch phases (“B step”) in which columns are disconnected and operated in single-column mode and interconnected phases (“IC step”) in which columns are connected in series. A batch and subsequent interconnected phase together are called a “switch,” and two subsequent switches make up one “cycle.” A start-up phase (“start-up”) in which columns are interconnected helps the process rapidly reach a cyclic steady state. In that phase, both columns are loaded until column 2 is saturated.
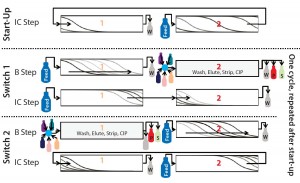
Figure 1: Schematic of the CaptureSMB process shows a start-up phase and two switches (one cycle). Outlet streams are W (weak/nonadsorbing components in the flow-through and during wash), P (product component in the elution phase), and S (strong adsorbing component during the CIP phase)
The next step is the first switch’s batch phase (“Switch 1, B step”). Column 1 continues to be loaded, but such that no product breaks through. Meanwhile column 2 is washed, eluted, stripped, cleaned, and equilibrated. At the end of this batch phase, column 2 is ready to receive new product, and column 1 is close to the point at which 1% of the feed concentration appears in the flow through.
The following phase is the interconnected phase (“Switch 1, IC step”), in which the outlet of column 1 is connected to the inlet of column 2. As in the start-up phase, both columns are loaded until column 1 is nearly completely saturated. The amount of product on the downstream column is called preload.
From that point on, batch and interconnected phases alternate. In the second switch, the same tasks are carried out as in the previous batch and interconnected phases, but with the columns in opposite order. The two switches (“Switch 1” and “Switch 2”) that represent one cycle of the process now can be repeated continuously until the entire feed amount has been consumed.
Alternatively, a CaptureSMB process can be combined with continuous upstream processing (fermentation) by using a balancing container before the capture step. The process reaches a cyclic steady state: Process performance parameters such as product concentration, yield, productivity, and buffer consumption do not change from cycle to cycle.
The advantages of this technology over traditional batch chromatography come from a number of features. First, the interconnected loading phase with the second column catching breakthrough from the first column allows for faster loading and broader breakthrough curves. That is often relevant for affinity capture, when mass-transfer properties rather than pressure drop are limiting during the loading phase. Second, columns are eluted only when they are fully loaded, which maximizes resin capacity use and product concentration. Third, the columns operate in single-column mode when eluted, allowing for faster elution. During elution, pressure drop of the columns is usually the limiting factor. Thus, elution can be performed twice as fast with columns in single- column mode because their bed height is lower than that of a batch column.
All those features reduce resin and buffer costs compared with batch processes. Continuous capture already has been described with three- and four-column processes (6–8). And the twin-column CaptureSMB process has been described for MAb capture (5). The advantages of twin-column processes over those with more than two columns come from a reduced amount of necessary hardware, which decreases capital expenditures as well as the risk of mechanical breakdown while operating at similar or better productivities.
Materials and Methods
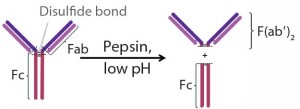
Fragment Generation: ETH Zurich in Switzerland provided clarified cell culture harvest containing IgG1. Digesting the IgGs in supernatant with pepsin at a pH of 4.0 for four hours produced antibody fragments (Figure 2) (9). After that, we neutralized the mixture to pH 7.0 using 1M-Tris to deactivate the pepsin. A protein A step removed remaining undigested antibody and Fc fragments from the mixture by selectively binding them to the Fc regions. F(ab′)2 concentration in the flow-through, which served as feed for the capture step, was 0.3 g/L.
Batch and CaptureSMB Experiments: We used ECOplus AB self-packed columns (5 × 50 cm) from YMC in Japan filled with Capto L resin from GE Healthcare in Sweden for all experiments. We used ContiChrom Lab-10 equipment from ChromaCon AG in Switzerland and Knauer GmbH in Germany and ChromIQ operating software in all our preparative chromatography runs. For batch reference experiments, we interconnected two columns to obtain a total bed height of 10 cm. Here are the buffers we used:
- Buffer A — 25 mM sodium phosphate (Na–Phos) and 150 mM NaCl at pH 7.5
- Wash — 25 mM Na–Phos and 1 M NaCl at pH 7.5
- Buffer B — 25 mM Citric acid at pH 3.0
- Clean-in-place (CIP) — 15 mM NaOH.
Analytics: We used size- exclusion, high-performance liquid chromatography (SEC-HPLC) to confirm composition and masses of our fragment samples. This involved a 4.6 × 300 mm TSKgel G3000SWxl column from Tosoh Bioscience in Japan run for 40 minutes at a flow rate of 0.4 mL/ min with a 150 mM K-Phos buffer at pH 6.5.
To determine the concentration of the main product in our samples, we used analytical cation-exchange HPLC (CEC-HPLC) with a 4.6 × 100 mm Tosoh SP STAT 7-µm column. The method included a 0– 30% buffer B (25 mM Na–Phos and 1M NaCl at pH 6.0) gradient over 30 minutes at a flow rate of 0.5 mL/min. Buffer A was 25 mM Na–Phos at pH 6.0.
For sodium-dodecyl sulfate polyacrylamide gel electrophoresis (SDS-PAGE), we used NuPAGE Bis NuPAGE Novex 4–12% Bis– Tris protein gels (1.0 mm, 10-well) on an XCell SureLock Mini system (all from Life Technologies) with a Precision plus All Blue prestained protein standard from Bio-Rad Laboratories under reducing and non-reducing conditions. The NuPAGE sample-reducing agent also came from Life Technologies. We loaded and ran the gel according to manufacturer’s instructions.
Results
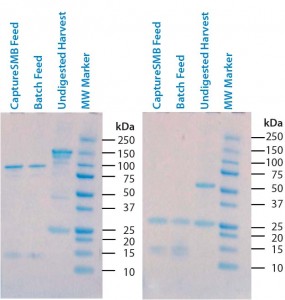
Figure 3: Sodium-dodecyl sulfate polyacrylamide gel electrophoresis (SDS-PAGE) of undigested supernatant and two batches of digested supernatant; (left) nonreducing conditions; (right) reducing conditions
Digestion: Pepsin digestion and successful removal of Fc-containing fragments was confirmed with reducing and nonreducing SDS-PAGE. Figure 3 shows gels from both undigested and digested harvest. On nonreducing gels, the undigested harvest has a band at 150 kDa that corresponds to the full-size antibody. Digested samples have a clear band at 100 kDa that corresponds to the F(ab′)2 fragments. Full-size antibodies and Fc fragments (50 kDa) are completely absent in the digested, protein-A– purified samples (CaptureSMB and batch feeds), indicating their successful removal. On the reducing gel, the undigested feed displays a band at 50 kDa that corresponds to intact IgG heavy chains. An absence of intact heavy-chain bands in the CaptureSMB and batch feed samples confirms complete pepsin cleavage.
F(ab’)2 Capture Case Study: F(ab′)2 fragment capture was performed with batch and CaptureSMB chromatography processes.
Reference Batch: For our reference batch, we used two columns connected in series to provide the same bed height as the interconnected phase of the CaptureSMB process. Table 1 shows our method for this run, and Figure 4 is the resulting chromatogram. During the loading phase, the UV detector is set in the nonlinear range, but the UV signal decreases to zero during the wash step. During elution, a single peak is eluted from the column and collected as a product pool.
Table 1: Reference batch-run process parameters; CV = column volumes
| Flow Rate | 1 mL/min | |
| Equilibration | 8 CV | Buffer A |
| Feed | 13.9 CV | Feed |
| Wash 1 | 5 CV | Buffer A |
| Wash 2 | 5 CV | Wash buffer |
| Wash 3 | 5 CV | Buffer A |
| Elution | 5 CV | Buffer B |
| Strip | 3 CV | Buffer B |
| CIP | 2 CV | CIP buffer |
| Reequilibration 1 | 2 CV | Buffer B |
| Reequilibration 2 | 8 CV | Buffer A |
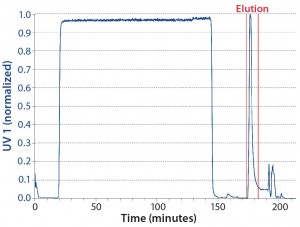
Figure 4: Chromatogram of the batch reference run; product collection pool limits are indicated by vertical red lines.
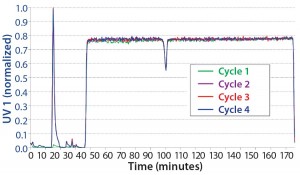
CaptureSMB: We determined process parameters for breakthrough experiments using a CaptureSMB process-design wizard that is integrated into the ChromIQ software (Table 2). Based on a maximum flow rate of 1 mL/min, we ran the CaptureSMB for four cycles. It had reached a cyclic steady state by the second cycle. Figure 5 overlays the four cycles. Because we ran this process without a stawwrt- up phase, there is no product elution in the first cycle of the batch phase. Nevertheless, the process rapidly reached a cyclic steady state, which is evident from the exact overlay of the elution peak UV signals of cycles 2–4 during the batch phase (at 10–20 minutes).
Table 2: CaptureSMB process parameters
| QB | 0.50 mL/min |
| tB | 35.5 min |
| QIC | 1.0 mL/min |
| tIC | 50.4 min |
We pooled product obtained from all CaptureSMB cycles and analyzed it with SEC-HPLC. Figure 6 overlays the resulting chromatograms of purified CaptureSMB product and feed. The relative concentration of the ~21-minute peak is much higher in the product. That peak corresponds to the F(ab′)2 fragment. Based on peak integration of the SEC chromatograms, we determined the purity to be 2% for the feed and 74% for the CaptureSMB product.
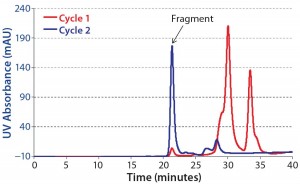
Figure 6: Overlay of analytical SEC chromatograms; blue = purified F(ab’)2 fraction from CaptureSMB run; red = feed
Comparing Batch and CaptureSMB Results: Table 3 shows performance data for batch and CaptureSMB runs. The latter process had better values for all criteria: The load was improved by >60%, productivity was almost doubled, and buffer consumption was decreased to under half that of the batch process. The decrease in buffer consumption can be attributed to the much higher amounts of product per volume of elution and cleaning buffers, an effect of the increased loading. That loading also increases product concentration. In this case, the product concentration was more than twice as high when we used the twin-column, countercurrent process. Significant performance benefits thus can be achieved using CaptureSMB technology. However, we do not consider the unexpectedly low yield of the batch run to be representative.
Table 3: Performance data of CaptureSMB and batch chromatography; Yield = compound recovered; Prod = productivity; BC = buffer consumption, Load = amount loaded per cycle or batch; Cpr = product concentration. Accuracy of analytics for quantifying the yield is about 5%.
| Yield | Prod | BC | Load | Cpr | |
| Batch | 80.2% | 2.8 g/L/h | 4.9 L/g | 9.2 g/L | 1.4 g/L |
| CaptureSMB | 105.4% | 5.4 g/L/h | 2.3 L/g | 15.0 g/L | 3.1 g/L |
| Improvement | +93% | -54% | +64% | 2.2x |
Cost Evaluation: We compared resin costs and buffer consumption for operating CaptureSMB and batch processes in a production scenario of 100 kilograms per annum (kg/year) under assumptions listed in Table 4 and based on the experimentally determined load values in Table 3. We assumed that the F(ab′)2 could be increased to 1.0 g/L, that the yield of both processes was 95%, and that bed height was 10 cm for all columns. Those with bed heights <10 cm generally are considered to be not packable reproducibly on a large scale and were therefore not considered in the modeling.
Table 4: Assumptions for resin cost evaluation of CaptureSMB and batch chromatography
| Production | 100 kg/a |
| F(ab’)2 titer | 1.0 g/L |
| Number of harvests | 20/year |
| Harvest volume | 5000 L |
| Harvest processing time | 24 h |
| Resin cost | $20,000/L |
| Resin life time | 50 cycles |
The CaptureSMB process required two 37-cm ID columns; batch capture required a single column of 68 cm. Our economic evaluation results summarized in Table 5 show that using the twin- column countercurrent technology can reduce resin costs and buffer consumption by >30%. For resin and buffer use >150,000 L, that corresponds to an annual cost savings of US$2 million. The total resin volume needed each year would be 150 L for a CaptureSMB process; it would be 250 L for batch chromatography. The Capto L resin cost — >$30per gram of F(ab′)2 — is somewhat higher than for protein A MAb affinity capture (typically in the range of $4–10/g MAb). The high resin cost is due to the lower binding capacity of the stationary phase for F(ab′)2 capture. The resin itself is more expensive, and its shorter life time reflects the manufacturer’s inability (so far) to develop alkaline-resistant ligands for Fab fragment capture.
Table 5: Economic evaluation of a CaptureSMB process
| CaptureSMB | Batch | |
| Resin costs | $31/g | $46/g |
| Annual resin costs | $3,000,000/year | $5,000,000/year |
| Buffer consumption | 230,000 L/year | 390,000 L/year |
| Column diameter | 37 g | 68 g |
| Number of column packings per year | 7/year | 7/year |
| Annual resin demand | 150 L/year | 250 L/year |
Discussion
For all key parameters, the twin- column countercurrent process shows better performance than the batch process. Productivity is improved by >90% in the experiments and >65% in the simulation (with 10-cm bed- height columns). Buffer consumption decreased by >50% in the experiments and >40% in the simulation. The amount of compound produced per cleaning step (proportional to the resin load) also influences resin costs because cleaning is considered to play a major role in resin aging (10). Concentration of the compound produced is 2.2-fold (experiment) and 1.6-fold (simulation) higher than that from batch chromatography. Such higher concentration is preferred because the next step in downstream processing can more easily handle the smaller volume (in less time). Depending on the step, it could even be downsized. The main cause for those advantages is that in the CaptureSMB process, columns are loaded up to a break-through of 70% without a decrease in yield. The compound that breaks through from the upstream column is captured by the second column.
Our study has shown that twin-column countercurrent chromatography is not limited to capture of whole antibodies with protein A affinity resin, but it also can be applied to capture antibody fragments using a different stationary phase. We did not perform a detailed purity analysis; however, other authors have confirmed that product purity is not compromised by sequential loading principles (8).
So in the F(ab′)2 capture case, increased productivity with CaptureSMB technology allows for downsizing of columns and/or reduction of processing time. Ultimately, column downsizing could reduce resin costs by >30%. For a 100-kg/year F(ab′)2 production, a company could achieve resin cost savings of $2.0 million/year while using >150,000 L less buffer volume. Alternatively, two processes operating with the same resin volume, harvest processing time could be reduced from 24 to 14 hours. Thus could valuable good manufacturing practice (GMP) suite time be saved while enabling potential reduction of operations to two work shifts. Combining those two options is also possible, which could enable flexible manufacturing.
References
1 Flanagan RJ, Jones AL. Fab Antibody Fragments: Some Applications in Clinical Toxicology. Drug Saf. 27(14) 2004: 1115–1133.
2 Hust M, et al. Single Chain Fab (scFab) Fragment. BMC Biotechnol. 7(14) 2007; www.biomedcentral.com/1472-6750/7/14.
3 Morrison SL. Two Heads Are Better Than One. Nat. Biotech. 25(11) 2007: 1233– 1234.
4 Nelson AL. Antibody Fragments: Hope and Hype. MAbs 2(1) 2010: 77–83.
5 Müller-Späth TA, et al. Increasing Capacity Utilization in Protein A Chromatography. BioPharm Int. 26(10) 2013: 33–38.
6 Warikoo V, et al. Integrated Continuous Production of Recombinant Therapeutic Proteins. Biotechnol. Bioeng. 109(12) 2012: 3018–3029.
7 Godawat R, et al. Periodic Counter- Current Chromatography: Design and Operational Considerations for Integrated and Continuous Purification of Proteins. Biotechnol. J. 7(12) 2012: 1496–1508.
8 Mahajan E, George A, Wolk B. Improving Affinity Chromatography Resin Efficiency Using Semi-Continuous Chromatography. J. Chromatog. A 1227, March 2012: 154–162.
9 Andrew SM, Titus JA. Fragmentation of Immunoglobulin G. Current Protocols in Cell Biology. John Wiley & Sons, Inc.: Hoboken, NJ, 2001.
10 Jiang C, et al. A Mechanistic Study of Protein A Chromatography Resin Lifetime. J. Chromatog. A 1216(31) 2009: 5849–5855.
Nicole Ulmer is a process engineer, corresponding author Thomas Müller-Späth is chief operating officer, Lars Aumann is chief technology officer, and Michael Bavand is chief executive officer at ChromaCon AG, Technoparkstraße 1, 8005 Zürich, Switzerland. Benjamin Neunstoecklin (benjamin.neunstoecklin@chem.ethz.ch) and Massimo Morbidelli (massimo.morbidelli@chem.ethz.ch) are researchers in the Institute for Chemical and Bioengineering at the Swiss Federal Institute of Technology (ETH Zürich) Wolfgang-Pauli Straße 10, 8093 Zürich, Switzerland.

