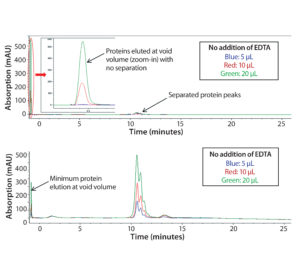
Figure 1: Chromatograms of Protein F sample tested on a Tosoh Q-STAT column without (top) and with (bottom) 50 mM EDTA added to the sample matrix; injection volume varied from 5 to 10 and 20 µL.
The concept of quality by design (QbD) initially was outlined in ICH Q8 guidance for drug-product development and later in Q11 for drug-substance development (1, 2). Since then, the QbD concept was further expanded to the development of analytical methods. FDA issued a 2015 guidance on analytical procedures and method validation for drugs and biologics (3). Although the agency did not explicitly state the requirement for implementation of QbD in analytical method development, the concept is embedded in its section on analytical method development, including these two quotes:
Early in the development of a new analytical procedure, the choice of analytical instrumentation and methodology should be selected based on the intended purpose and scope of the analytical method. . . .
To fully understand the effect of changes in method parameters on an analytical procedure, you should adopt a systematic approach for a method robustness study (e.g., a design of experiments with method parameters). You should begin with an initial risk assessment and follow with multivariate experiments. Such approaches allow you to understand factorial parameter effects on method performance.
Those expectations are in line with the concept of QbD in ICH Q8 as “a systematic approach to development that begins with predefined objectives and emphasizes product and process understanding and process control, based on sound science and quality risk management.” And the US Pharmacopeial Convention’s Chemical Analysis Expert Committee has published a stimulus paper on developing a new general chapter <1220> covering the “analytical procedure lifecycle.” It has begun to adopt the QbD concept for analytical procedure design and development (4).
Here, we present a seven-step workflow for analytical method development using a QbD approach, considering that fewer case studies are available for biologics than for small molecules (5–7). We used one proprietary recombinant protein product (herein designated “Protein F”) as a model protein for the case study. One of its domains contains multiple carboxylate residues (negatively charged). The intended purpose of our method is to separate charge variants differentiated by the numbers of carboxylate residues in that domain (presumably up to 10 per molecule).
Materials and Equipment
Instrument: We developed a high-performance liquid chromatography (HPLC) method using Agilent 1100 and 1260 HPLC systems with a thermostatted column compartment and a UV detector.
Method Parameters: Our optimized method condition includes the use of a Tosoh Bioscience TSKgel Q-STAT HPLC column (catalog #21960). Mobile phase A is 50 mM Tris at pH 8.5, and mobile phase B is 50 mM Tris with 1.0 M NaCl at pH 8.5. The flow rate is 1.0 mL/min. Column temperature is 25 °C. The injection volume is 10 µL. UV detection occurs at 280 nm wavelength. The elution gradient (linear change) goes from 15% B to 30% B at 20 minutes, followed by eight minutes of column wash with 100% B and five minutes of equilibration at 15% B.
Sample Preparation: Addition of 50 mM ethylenediaminetetraacetic acid (EDTA) to the samples is used to deplete calcium ions.
Statistical Analysis: We used JMP software (SAS, Inc.) for statistical analysis including design of experiments (DoE).
Method Development Results
Step 1 — Method Development Planning: An analytical target profile (ATP) normally is defined during the planning of method development, and it may evolve throughout development. ATPs include the intended use and validation requirements of an analytical method. In addition, a preliminary risk assessment should be performed to identify potential analytical challenges based on molecular properties, a literature search, prior experience/knowledge, and available technical capabilities.
In this case study, we intended the assay for separating Protein F charge variants based on their different carboxylate levels. Anion-exchange (AEX) HPLC method is the ideal choice for this purpose because carboxylate residues are negatively charged. Ideally, the domain with multiple carboxylates should bind to an AEX column, with elution depending on the charge strength of that domain. At basic pH, however, the other two domains of the molecule also could be negatively charged and bind to the AEX resin, affecting selectivity of the separation. Therefore, buffer pH should be evaluated carefully to allow for specific binding of the AEX resin with the carboxylate domain but minimum binding with other domains.
Specific challenges of Protein F analysis were identified as follows: It was known from literature that Ca2+ in the sample matrix (although essential) could induce a conformational change to the carboxylate domain. That change can fold carboxylate residues into the domain core and cause loss of binding to the AEX resin.
Protein F is prone to autoactivated degradation, becoming an impurity under certain conditions, including interaction with a positively charged surface. Considering that AEX resin is positively charged, the potential for autoactivation should be accounted for.
Step 2 — Early Assay Scouting: The chosen chromatographic column can determine the performance of an HPLC method. During early scouting studies, we evaluated five types of AEX columns from different vendors. We conducted preliminary scouting with 50 mM Tris at pH 8–9 as a buffer system with a broad salt-gradient elution from 0 to 500 mM NaCl.
Agilent’s Buffer Advisor software helped us generate different pH and salt gradients for dynamically mixing four components (mobile phases) on a quaternary-pump HPLC system: (A) water, (B) 2 M NaCl, (C) 200 mM Tris HCl, and (D) 200 mM Tris base. The software dramatically reduced the time and workload needed for buffer preparation.
We found that the Q-STAT column from Tosoh Bioscience exhibited the best resolution and fastest elution among the five candidate columns evaluated, so we selected that for further optimization.
In early scouting, we had confirmed that the presence of Ca2+ in the sample matrix could reduce substantially binding of Protein F to the AEX column and decrease protein recovery, which is in line with our Step 1 assessment above. As Figure 1 (top) shows, direct injection of the sample resulted in significant protein loss (protein elution at the column void volume without separation). This issue was more dramatic with higher sample injection volumes.
To disrupt the Protein F–Ca2+ interaction, we added EDTA into the sample to deplete Ca2+. As Figure 1 (bottom) shows, most Protein F remained on the column through charge interaction at low salt concentration and eluted later at high salt concentration. Well-separated charge-variant profiles were consistent at different injection volumes (5, 10, and 20 µL).
However, it’s interesting to note that adding EDTA directly to the mobile phases could not resolve the protein recovery issue. Competitive binding of EDTA to the positively charged functional groups on the column resin may be the problem. We discovered that adding EDTA to the samples still could affect column performance over time. That performance has to be monitored carefully to ensure consistent data. The column could be regenerated by a vender-recommended cleaning procedure (0.1 M NaOH wash).
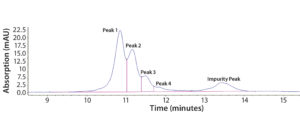
Figure 2: Representative chromatogram of Protein F sample eluted on a Tosoh Q-STAT column using a 0–500 mM salt gradient at pH 8.5 before DoE optimization; charge variants are shown as Peaks 1–4, and degraded product is referred to as the “Impurity Peak.”
Step 3 — Initial Optimization Using DoE: Our early assay-scouting results proved that AEX-HPLC is an effective method to separate charge variants. We observed four charge-variant peaks (Figure 2). As discussed above, Protein F is prone to autoactivation (degradation). In Figure 2, the peak coming after the charge-variant peaks represents the degradation product (impurity) before DoE optimization. The impurity could be a mixture of actual product-related impurity generated from the manufacturing process and assay-induced impurity from the AEX-HPLC column. The column has a positively charged surface that could induce such degradation. Therefore, one main goal in our DoE study was to minimize assay-induced impurities during further assay development.
Here we designate the charge variants as Peak 1, Peak 2, Peak 3, and Peak 4, referring to the degraded product as Impurity Peak. We use sums of the peak areas (PAs) for the corresponding charge variants to evaluate protein recovery, which serves as an opposite indicator for the extent of assay-induced degradation on the AEX column.
PAs are defined as follows: For total Protein F peak area, TPFPA = PAPeak 1 + PAPeak 2 + PAPeak 3 + PAPeak 4. For total protein peak area, TPPA = TPFPA + PAImpurity Peak. For relative peak area (RPA) of the impurity peak, RPAImpurity Peak (%Impurity) = PAImpurity Peak ÷ TPPA × 100%.
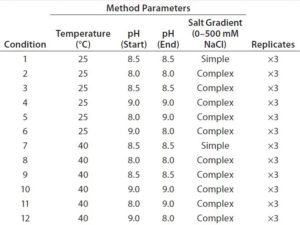
We created a fractional factorial design to evaluate four method parameters: column temperature (25 or 40 °C), beginning and ending pH, and salt-gradient complexity (simple and complex gradients, 0–500 mM NaCl). The latter concerns a minor drift in pH caused by changing ionic strength in the salt gradient. Our simple salt gradient is a typical linear salt gradient without compensating for that pH drift. We created our complex salt gradient using Agilent’s Buffer Advisor software by including several additional pH target points along the gradient to minimize the drift. We tested each condition of the DoE study in triplicate (Table 1) and considered the four method parameters to be potential critical method parameters (CMPs). Based on prior experience, we did not consider other assay parameters (e.g., injection volume and flow rate) to be critical.
On the other hand, we identified four chromatographic characteristics as critical method attributes (CMAs) for assessing assay performance: TPPA, TPFPA, resolution of Peaks 1 and 2, and resolutions of Peaks 2 and 3. TPPA and TPFPA are indicators of protein recovery from column elution, which should be maximized to ensure assay accuracy. The peak resolutions are standard CMAs for HPLC assays.
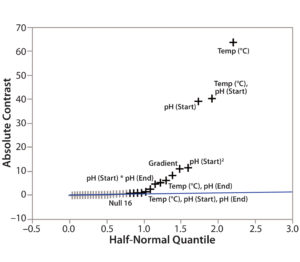
Step 4 — CMP Identification: To determine the criticality of potential method parameters, we used the Screening Plot (Half-Normal Plot) function in JMP based on the DoE data in Table 1. For example, we showed the method parameters’ effects on TPPA (Figure 3). In the Half-Normal Plot function, if the effect of one method parameter on CMA is insignificant, then its absolute-contrast value would be random noise close to the trending line. A value that falls far from the trending line represents a significant effect. In other words, the farther away from the trending line a method parameter falls, the stronger its effect is on the given CMA (TPPA in this case). Thus we concluded that column temperature is a CMP because of its significant effect on TPPA (protein recovery). More quantitative criteria could be developed using the contrast value for each parameter of the analysis (data not shown).
Step 5 — DoE Modeling of the CMP–CMA Relationship: After identifying all CMPs for all the CMAs, we generated a statistical DoE model to simulate the relationships among them by fitting the same set of DoE data (Table 1).
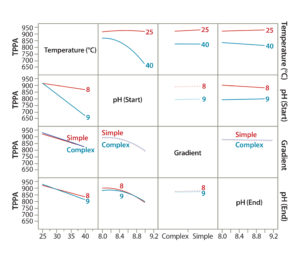
Figure 4: Demonstrating the effect of CMPs on a given CMA using DoE modeling; interaction profiles plot showing effects of each CMP and their combined effects on the CMA (TPPA as an example).
To evaluate the effects of all CMPs and their interactions (combinational effect) on a given CMA, we used JMP’s Interaction Profiles Plot function. Figure 4 is an example correlation for the TPPA CMA (TPPA). In this plot, the overlapping lines (such as complex and simple gradients) indicate parameters with insignificant effects on the method attribute, whereas parallel lines (such as for temperature) indicate those with significant effects. Lines with differing trends indicate combinational effects (such as temperature and starting pH). We evaluated other CMAs such as resolution in the same way (data not shown).
JMP’s Summary of Fit function (Figure 4) demonstrated good fitting of our DoE models for each CMA, with an R2 of 0.999. From the DoE modeling, we concluded the following: Higher column temperature significantly reduced TPPA, the indicator for protein recovery. At 40 °C, the reduction was more severe with a higher starting pH than with a lower one. At 25 °C, TPPA was not affected significantly by the starting pH, which could help improve the robustness of this analytical method. However, higher column temperature slightly improved its resolution (Peak 1 and Peak 2), especially with a higher starting pH. Taking into account all this information, we decided that a 25 °C column temperature should be used for further assay development because protein recovery is the primary consideration.
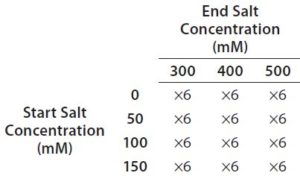
Table 2: Full factorial experiment design for optimization of salt gradient on a Tosoh Bioscience Q-STAT column
Higher starting and ending pH values (pH 8–9) slightly improved peak resolution, but ending pH did not affect TPPA significantly. We saw peak fronting at pH 8.0 compared with pH 8.5 and 9.0, probably because of incomplete deprotonation of the carboxylic acid residues in the domain at lower pH. Considering all this information, we decided that using the pH gradient offered no significant benefit. Therefore, we used a Tris buffer at fixed pH (≥8.5) and a salt gradient in further assay development.
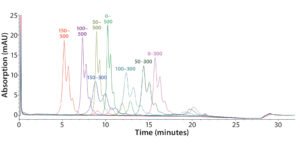
Figure 5: Representative overlaid chromatograms from a DoE study to optimize the salt gradient (mM); 150–300 mM is the final gradient.
Step 6 — Method Fine-Tuning and Design Space: To explore a wide range of CMPs in a screening DoE study, we used the fractional factorial design. From this study, we concluded that the pH gradient would not be needed. The next step was to fine-tune the salt gradient. For that purpose, we created another full-factorial design (Table 2) that would test each condition in six replicates. Figure 5 shows a representative overlaid chromatogram.
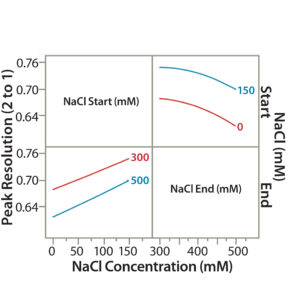
Figure 6A: Interaction profile (6A) and contour profiles (6B) plots show the salt-gradient design space and its effect on resolution (between Peaks 1 and 2).
Similar to our statistical approaches in step 5, we used the new set of DoE data to show the effect of CMAs (starting and ending salt concentrations) on peak resolution (e.g., resolution between Peaks 1 and 2 in Figure 2). A higher start salt concentration (150 mM) significantly improved the peak resolution. TPFPA, the indicator of the Protein F recovery, was significantly better at higher start salt concentrations (data not shown). A lower-end salt concentration (300 mM) also improved peak resolution but had minor effects on TPFPA (data not shown).
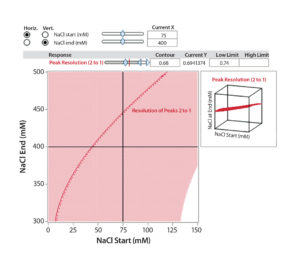
Figure 6B: Interaction profile (6A) and contour profile (B) plots show the salt-gradient design space and its effect on resolution (between Peaks 1 and 2).
The unshaded area at the right bottom corner of Figure 6B shows the salt-gradient design space in terms of its effect on resolution, based on a contour profiler plot. This design space covers a starting salt concentration around 150 mM and an ending salt concentration around 300 mM. Within these defined parameters, the gradient would ensure that both resolutions (between Peaks 1 and 2 and Peaks 2 and 3) are no lower than 0.7.
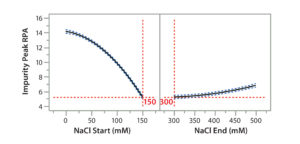
Figure 7A: Using statistical tools to fine-tune an analytical method; (7A) Prediction Profiler plot predicts the impurity peak level in relative peak area (RPA) with changing start and end salt concentrations; (7B) actual resolutions (between Peaks 1 and 2, between Peaks 2 and 3) with starting salt concentrations; (7C) actual RPA of the impurity peak against starting salt concentration
Statistical tools also can be used to predict the results of further optimization efforts. Considering that the design space falls into the corner of the graph (Figure 6B), we wondered whether we could further increase the starting salt concentration and/or lower the ending salt concentration beyond the range of the DoE study (Table 2) to make the gradient shallower for even better resolution and recovery of Protein F. That seemed to be a reasonable expectation when we used JMP’s Prediction Profiler function to project the effects of starting and ending salt concentrations on formation of the assay-induced impurity peak. As shown in the modeling (Figure 7A), the RPA of the impurity peak could decrease further along the increase of the starting salt concentration beyond 150 mM, whereas the RPA already reached a plateau at the ending salt concentration of 300 mM. Thus, we collected additional DoE data at a starting-concentration range of 140–200 mM, with a fixed ending concentration of 300 mM.
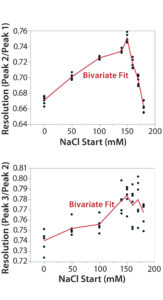
Figure 7B: Using statistical tools to fine-tune an analytical method; (7A) Prediction Profiler plot predicts the impurity peak level in relative peak area (RPA) with changing start and end salt concentrations; (7B) actual resolutions (between Peaks 1 and 2, between Peaks 2 and 3) with starting salt concentrations; (7C) actual RPA of the impurity peak against starting salt concentration
It turned out that the charge-variant peaks eluted too fast with insufficient separation when we used a 200 mM starting salt concentration (data not shown). Nevertheless, as we plotted the resolutions and RPA of the impurity peak against the starting salt concentration (0–180 mM), both resolutions (between Peaks 1 and 2 and between Peaks 2 and 3) reached their highest levels with a starting concentration of ~150 mM (Figure 7A–C). On the other hand, RPA of the impurity peak decreased and reached a plateau in the range of 140–180 mM for a starting salt concentration. The RPA plateau indicates that the assay-induced impurity has been minimized to its lowest level. Because RPA is the reportable value for that impurity, the RPA plateau ~150 mM starting salt concentration is a good sign of method robustness.
Our additional study (Figure 7A–C) further confirmed that a gradient from 150 mM (start) to 300 mM (end) maximizes assay performance while minimizing assay-induced artificial impurities. That was in line with the Figure 6 design space. Therefore, we locked down this salt-gradient condition for the final procedure.
Step 7 — Additional Verification Studies to Finalize Procedure: In the steps above, we had optimized a salt gradient as one final method condition. CMAs used in that optimization are indicators of chromatographic performance but not necessarily reportable values of the method. Thus, it was important to investigate method robustness further using reportable values with adequate replicates in the defined design space. In this case, the reportable results (the RPA of each charge variant peak) are consistent with a starting salt concentration of 150 ± 10 mM (data not shown).
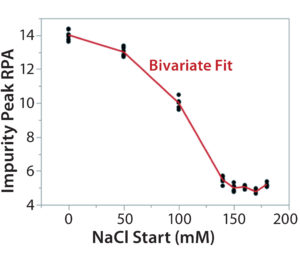
Figure 7C: Using statistical tools to fine-tune an analytical method; (7A) Prediction Profiler plot predicts the impurity peak level in relative peak area (RPA) with changing start and end salt concentrations; (7B) actual resolutions (between Peaks 1 and 2, between Peaks 2 and 3) with starting salt concentrations; (7C) actual RPA of the impurity peak against starting salt concentration
Column lot-to-lot variation should be checked as part of HPLC method development. We recommend using at least three column gel lots to do so. Information regarding column qualification, maintenance, and conditioning should be captured in a given method’s procedure and/or development report.
Discussion
We used a seven-step QbD workflow to develop an AEX-HPLC method that minimizes an assay-induced impurity and provides optimal separation of charge-variant peaks for Protein F. The QbD approach for analytical development normally starts with defining a method’s ATP, which then sets requirements for the method to deliver. Besides that, it is important in the planning stage to assess analytical challenges and analyte-specific information that affect method performance. Prior and platform experience with similar molecules helps us narrow down initial conditions for method scouting. In the real world, it may not be practical to evaluate every single method attribute and parameter in a laboratory, considering resource availability and instrument capacity. So science- and experience-based risk assessment is vital to prioritizing and narrowing down method parameters to a subset that can be evaluated experimentally.
DoE studies are the core of a QbD approach. When understanding of a method is limited in early development, it is practical to initiate a DoE screening study (e.g., a fractional factorial design or two-level Plackett-Burman design) of a broader range of parameters. That can identify CMPs and their relationships with CMAs. It can be followed by a full-factorial design with a narrowed range and more replicates to fine-tune a design space and method conditions. That can be an iterative process as you gain more experience with a molecule and method until an optimized method condition is achieved.
In practice, we started our initial DoE using a fractional factorial design to establish initial conditions, such as whether a pH gradient or pH–salt combined gradient would be needed. In a second DoE (full-factorial design), the focus is to fine-tune parameters (e.g., salt gradient, in our case) based on what is already concluded from the initial DoE study.
Every analyte is different. This is especially true for biologic products. So this DoE approach should be customized for each specific need in analytical development for every method and molecule.
Acknowledgments
We thank Paramjeet Bains for execution of experiments and Susan Chen for supporting our early scouting study.
References
1 ICH Q8 (R2). Pharmaceutical Development. US Fed. Reg. 71(98) 2009; www.ich.org/fileadmin/Public_Web_Site/ICH_Products/Guidelines/Quality/Q8_R1/Step4/Q8_R2_Guideline.pdf.
2 ICH Q11. Development and Manufacture of Drug Substances. US Fed. Reg. 77(224) 2012: 69634–69635; www.ich.org/fileadmin/Public_Web_Site/ICH_Products/Guidelines/Quality/Q11/Q11_Step_4.pdf.
3 CBER/CDER. Analytical Procedures and Methods Validation for Drugs and Biologics: Guidance for Industry. US Food and Drug Administration: Rockville, MD, July 2015; www.gpo.gov/fdsys/pkg/FR-2015-07-27/pdf/2015-18270.pdf.
4 Chemical Analysis Expert Committee. <1220> Stimuli to the Revision Process: Proposed New USP General Chapter — The Analytical Procedure Lifecycle. US Pharmacopeial Convention: Rockville, MD, 2016.
5 Phil N, et al. QBD for Better Method Validation and Transfer. Pharma. Manufact. 2010: 37–47.
6 Karmarkar S, et al. Quality By DesignBased Development of a Stability-Indicating HPLC Method for Drug and Impurities. J. Chromatog. Sci. 49, 2011: 439–446.
7 Monks K, et al. Quality By Design: Multi-Dimensional Exploration of the Design Space in High-Performance Liquid Chromatography Method Development for Better Robustness Before Validation. J. Chromatog. A 1232, 2012: 218–230.
Corresponding author Weijun Li, PhD, is senior manager of analytical transfers and special projects; Quan Yuan, PhD, is staff development scientist; and Lisa Regan, PhD, is vice president of analytical development and validation at Bayer Pharmaceuticals, 800 Dwight Way, Berkeley, CA 94701; 1-510-705-7526; weijun.li@bayer.com.

