Protein biopharmaceuticals have emerged as important treatments for diseases with otherwise unmet medical needs. These biologics are produced by recombinant mammalian, yeast, or bacterial expression systems. Along with therapeutic proteins, those cells produce endogenous host-cell proteins (HCPs) that can contaminate biopharmaceutical products despite multiple purification steps in downstream processing. Because such process-related impurities can affect product safety and efficacy, they need to be monitored closely.
Multicomponent enzyme-lined immunosorbent assays (ELISAs) presently are the workhorse method for HCP testing, with high throughput, sensitivity, and selectivity. Polyclonal antibodies used in the test typically are generated by immunizing animals with an appropriate preparation derived from production cells without the product-coding gene. But ELISAs do not recognize all HCP species completely — they cannot detect HCPs to which no antibody was raised — and in a multicomponent set-up, ELISAs have poor quantitation power. Mass spectrometry (MS) complements them nicely because it can provide both qualitative and quantitative information on individual and even previously unknown HCPs.
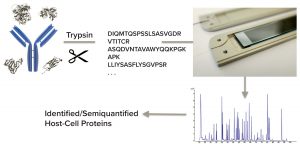
MS analysis of HCPs can be achieved through bottom-up proteomics approaches using peptides derived from HCP proteins following proteolytic digestion. Scientists can be confronted with great complexity and a large dynamic range, however, and the separation space can be dominated by peptides derived from the therapeutic protein. For successful HCP analysis, users need highly efficient separations in preparing MS samples. In that respect, micro-sized Pillar Array Column (μPAC) technology is highly promising. The columns are produced by a lithographic etching process that creates a perfectly ordered separation bed on a silicon chip. Because of their perfect order, peak dispersion is virtually eliminated to generate highly efficient separations.
HCP Analysis
We used μPAC columns in combination with a hybrid Quadrupole-Orbitrap MS system (Thermo Fisher Scientific) for characterization of HCPs throughout the downstream process of a therapeutic monoclonal antibody (MAb) fragment recombinantly expressed in Chinese hamster ovary (CHO) cells. Proteinaceous samples collected at different purification steps were reduced using dithiothreitol (DTT) and alkylated using iodoacetamide (IAA) before overnight trypsin digestion. We subsequently loaded 2 μg of digested sample spiked with four predigested protein calibrants — alcohol dehydrogenase (ADH) at 10 fmol/μg, phosphate regulon (PHO) at 1 fmol/μg, bovine serum albumin (BSA) at 0.5 fmol/μg, and eleven-nineteenleukemia (ENL) at 0.1 fmol/μg — through a micropillar-array–based precolumn on a 200-cm long μPAC column. Peptides were separated using a 116-minute gradient, and the MS operated in data-dependent acquisition (DDA) mode. We searched the resulting data against a CHO database extended with the sequence of the MAb fragment and the protein calibrants.
Figure 1 shows some important metrics for downstream-process samples. In the harvest sample, nearly 70,000 MS/MS spectra were obtained, and 12,731 unique peptides were identified, corresponding to 2,444 protein groups with at least one peptide spectral match (PSM) and 1,812 proteins with more than one PSM. We observed good clearance of these proteins throughout the purification process, in the last step of which the number of HCPs was reduced to two. The table excludes the MAb fragment, ADH, PHO, BSA, ENL, keratin, and trypsin from the protein-groups columns.
Semiquantitation of the HCPs identified with >1 PSM was achieved by spiking predigested proteins (ADH, PHO, BSA, and ENL) at known concentrations in every sample. We plotted the average intensity of the three most intense peptides per protein calibrant as a function of column load (expressed in fmole) and applied the slope of the resulting calibration curve (counts/fmole) for semiquantitation of HCPs in the corresponding sample. We adapted a procedure described by Silva et al. and commonly used in HCP quantitation (1).
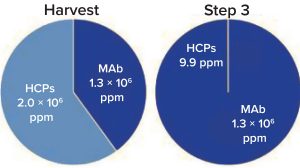
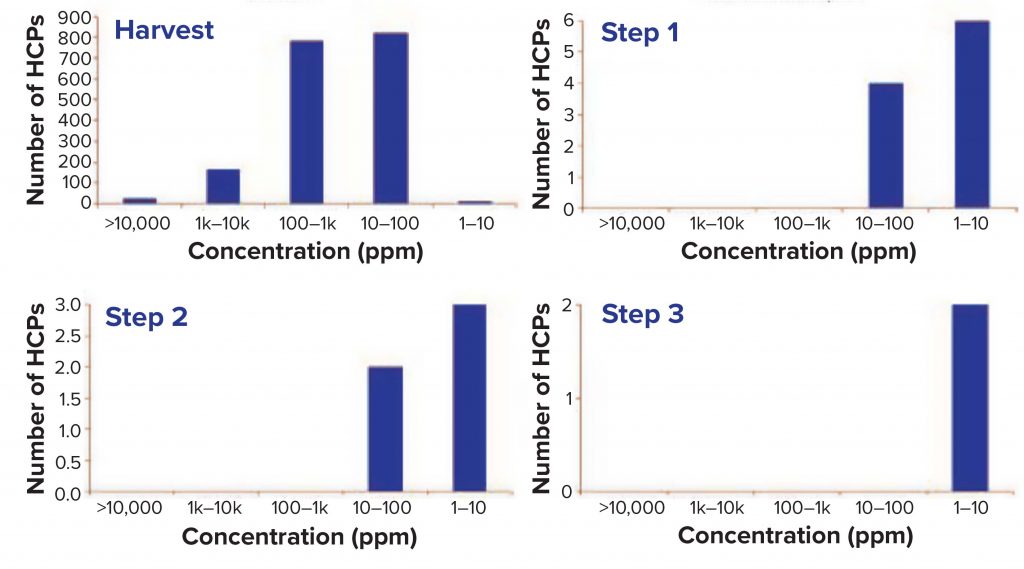
Figure 2 plots the number of HCPs detected at a given concentration in the different samples. Figure 3 shows that total HCP concentration (sum of all HCPs) in the harvest

Figure 3: Purification step 3 total HCP
concentration in harvest and final
purification samples as measured by mass
spectrometry (MS)
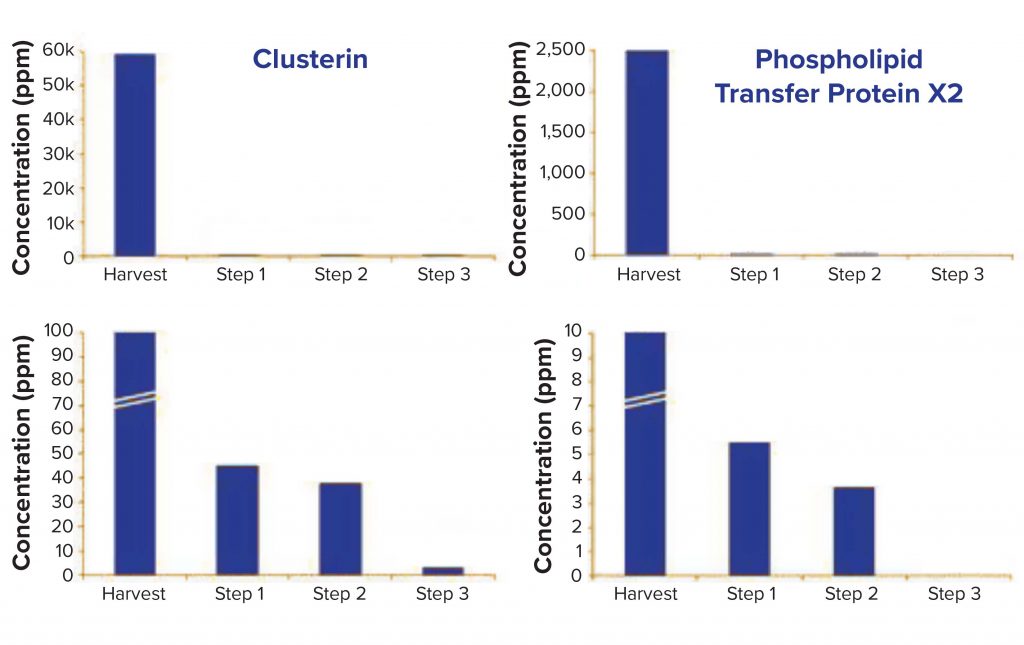
sample is 2 mg/mg, whereas in the final purification step, total HCP concentration drops to 9.9 ppm (9.9 ng/ mg). Figure 4 follows two specific HCPs throughout the process. Clusterin, for example, is present at 59,393 ppm in the harvest but reduced to 3.1 ppm in the final purification step. It has been described to associate easily and nonspecifically with both the Fc and Fab fragments of antibodies (2). Phospholipid transfer protein isoform X2 is present at 2,500 ppm in the harvest and reaches below detection limit in the final purification step. MS/ MS spectra showed phospholipid transfer protein isoform X2 and clusterin peptides both present at low ppm levels (data not shown); however, high-quality MS/MS data could be obtained for confident identification.

Figure 4: Evolution of Chinese hamster ovary (CHO) cell HCPs clusterin and phospholipid
transfer protein isoform X2 throughout the process
Results with Confidence
The utility of μPAC column technology is demonstrated for nontargeted monitoring and characterization of HCP impurities originating from recombinant expression systems in production of MAb-based biotherapeutics. Combined with high-resolution MS, the columns helped us monitor the presence of HCPs in different steps of a downstream purification process. Efficient clearance from harvest (>1,800 protein groups) to final purification (two protein groups) was illustrated, corresponding to respective HCP concentrations of 2.0 × 10⁶ ppm (harvest) and 9.9 ppm (purification step 3). Despite the broad dynamic range (1.0 × 10¹⁰ – 5.0 × 10⁶ on the MS1 level) over which tryptic peptides are present, this approach obtains decent MS/MS spectra for lowabundance peptides. That provides confident identification and semiquantification of HCP impurities at concentrations well below 5 ppm.
Acknowledgments
Thank you to Dr. Koen Sandra and his team at the Research Institute of Chromatography (RIC) in Belgium for input and contributions and to Professors Gert Desmet and Wim De Malsche of Vrije Universiteit in Brussels.
References
1 Silva JC, et al. Absolute Quantification of Proteins By LCMSE: A Virtue of Parallel MS Acquisition. Mol. Cell. Proteom. 5(1) 2006: 144–156; https://doi. org/10.1074/mcp.m500230-mcp200.
2 Wilson MR, Easterbrook-Smith SB. Clusterin Binds By a Multivalent Mechanism to the Fc and Fab Regions of IgG. Biochim. Biophys. Acta 1159(3) 1992: 319–326; https:// doi.org/10.1016/0167-4838(92)90062-i.
Jeff Op de Beeck, PhD, is a principal scientist; and Paul Jacobs, PhD, is chief operating officer of PharmaFluidics, Technologiepark-Zwijnaarde 82, B-9052 Ghent (Zwijnaarde), Belgium; 32-9241-5657.
This article will be published in the upcoming January-February 2021 issue of BioProcess International.


