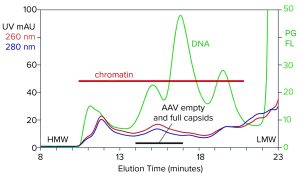
Figure 1: Analytical size-exclusion chromatography (SEC) of filtered harvest prestained with PicoGreen, monitored with UV and fluorescence; AAV8 lysate, 5.6 x 10¹⁰ vp/mL (HMW, LMW = high, low molecular weight, PG FL = PicoGreen fluorescence).
With its first licensed therapeutic now marketed worldwide (1), adeno-associated virus (AAV) has become a preferred vector for gene therapy. However, unlocking its full potential still poses challenges, many of which are associated with purification. The first involves the transition from upstream to downstream processes. AAV-bearing lysates are laden with debris that foul filtration media and limit or prevent concentration. Another challenge involves reduction of soluble host-cell DNA, which is complicated by its strong association with nucleoproteins. A third involves elimination of empty capsids. Currently, ultracentrifugation meets that need, but scale-up issues make chromatographic alternatives attractive. A fourth challenge involves the need for rapid, accurate, and revealing analytical results to guide process development, support validation, document control, and enable reproducibility of manufacturing processes. The following article shares experimental data showing how those challenges can be addressed to advance the evolution of gene therapy with AAV.
Methods
AAV8 lysates were obtained from the Center for Translational Therapy of Genetic Diseases at the University of Nantes (Nantes, France). In some experiments, 2 mL of prototype CIMasphere H-Bond particles (40–200 µm, BIA Separations) were added to 100 mL of filtered lysate and mixed for 60 minutes. The particles settled upon cessation of mixing, and the supernatant was filtered through a 0.45-µm membrane filter.
In other experiments, filtered lysate was diafiltered into 20 mM Tris, 500 mM NaCl, pH 7.5 by tangential-flow filtration (TFF) with a 300-kDa molecular-weight cutoff (MWCO) membrane. Afterward, transmembrane pressure was suspended. A salt-tolerant nuclease enzyme (Kryptonase, BIA Separations) was added to a final concentration of 50 units/mL along with magnesium chloride to a final concentration of 5 mM. The mixture was circulated to distribute the enzyme and then incubated at room temperature inside the TFF unit. TFF was recommenced to remove the enzyme, nucleotides, and nucleoproteins liberated by digestion of the DNA segments with which they were initially associated.
Capture purification was performed on 1-mL or 8-mL CIMmultus SO3 cation-exchange monoliths with 2-µm channels (BIA Separations). Polishing and empty-capsid reduction were performed with 1-mL CIMmultus QA or CIMmultus PrimaS monoliths with 2-µm channels. Some analytical chromatography samples were prestained with PicoGreen (Thermo Fisher Scientific) to enable in-line detection of DNA. Analytical size-exclusion chromatography (SEC) was performed on a G4000SWxl column (Tosoh Bioscience). Analytical ion-exchange was performed on 100‑µL CIMac monoliths (BIA Separations). Column effluents were monitored by UV at 260 nm and 280 nm, by fluorescence for PicoGreen detection and measurement of intrinsic tryptophan fluorescence, and by multiangle light scattering (MALS) to discriminate AAV particles from proteins and other nonparticulate contaminants.
Preparation for Chromatography
Figure 1 illustrates the analytical SEC profile of a filtered lysate prestained with PicoGreen dye, monitored by UV and fluorescence. The PicoGreen profile highlights host-cell DNA content. Its distribution is consistent with profiles from mammalian-cell culture harvests (2–5). Degraded chromatin in the form of nucleosomal arrays and fragments persists in sizes from 2 nm to 400 nm. Large species elute first, followed by progressively smaller species. AAV elutes at about 15.5 minutes but is difficult to recognize against the high chromatin background.
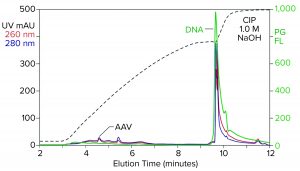
Figure 2: Analytical cation-exchange chromatography of filtered AAV8 lysate monitored by UV, PicoGreen fluorescence (PG FL), and multiangle light scattering; CIMac SO3 column, filtered AAV8 lysate (CIP = clean in place).
Analytical cation-exchange chromatography of filtered lysate confirms overwhelming chromatin contamination but provides different insights about its composition (Figure 2). Roughly 95% of the DNA resides in the 1 M NaOH cleaning peak. That is remarkable in itself because purified DNA does not bind to cation exchangers. Mutual repulsion between DNA negative charges and solid-phase negative charges forces DNA to flow through the column during sample application. Host-cell DNA behaves differently because it binds indirectly through the histone proteins with which it remains strongly associated (4, 5). Histones and other nucleoproteins bind cation exchangers so strongly that guanidine or NaOH is required to elute them.
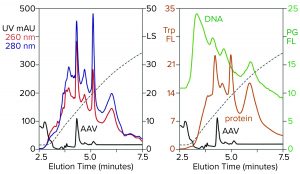
Figure 3: Zoomed image of the NaCl elution profile from Figure 2, monitored for UV, PicoGreen fluorescence (PG FL), tryptophan fluorescence (Trp FL), and multiangle light scattering (LS); CIMac SO3 column, filtered AAV8 lysate.
Figure 3 is a zoomed image of the elution gradient to 2 M NaCl from Figure 2, showing MALS, tryptophan fluorescence, PicoGreen fluorescence, and UV. All profiles have an AAV peak at about 4.6 minutes, but only MALS confirms that particular peak to be AAV. PicoGreen emphasizes excess DNA content across the profile. Tryptophan and UV profiles generally parallel that of PicoGreen. All rise steeply at the beginning of the gradient and slope gradually to the trailing side. These results collectively indicate that most contaminants are associated with chromatin.
Fluorescence profiles are noteworthy because they illustrate clearly what UV only hints at. The UV absorbance ratio of purified DNA at 260 nm and 280 nm is about 2:1. The ratio is reversed for proteins, most of which give 260/280 ratios in the range of about 1:2 to 1:3. Monitoring 260/280 ratios across chromatograms can provide some idea of where DNA or proteins are enriched relatively, assuming that only DNA and proteins are present. Unfortunately, cell culture harvests and lysates contain components with other UV absorption properties that limit the reliability of UV-based DNA/protein determination. Fluorescence removes the ambiguity. PicoGreen fluorescence shows only DNA. Tryptophan fluorescence shows only proteins.
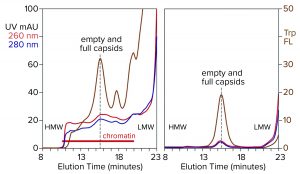
Figure 4: Analytical size-exclusion chromatography of AAV8 lysate before and after treatment with CIMasphere; monitoring by UV and intrinsic tryptophan fluorescence (Trp FL); (HMW, LMW = high, low molecular weight).
Capture By Cation-Exchange Chromatography
Excess chromatin poses an obvious problem for cation exchange as a capture method: It is certain to compromise binding capacity and purification of AAV. But excess chromatin also points to an obvious solution: Remove the chromatin in advance. In IgG purification studies, advance chromatin removal has increased product binding capacity by up to a factor of four, enhanced host protein reduction at capture by a factor of 100, and enhanced DNA removal by a factor of 10,000 (2–5). Lipid-enveloped virus and endotoxin both bind and are carried by chromatin (6–9), which could explain why chromatin elimination also reduces by both by 4–9 logs. Another reason to target chromatin early in a process is that it is antigenic (10, 11).
Figure 4 illustrates advance chromatin reduction by adsorbing chromatin to positively charged particles. Tryptophan fluorescence shows that AAV remains separate and soluble. Typical AAV recoveries at this stage range from 90% to 98%, as measured by vector plasmid recovery with polymerase chain reaction (PCR). Eliminating most of the chromatin enables effective capture by cation-exchange chromatography.
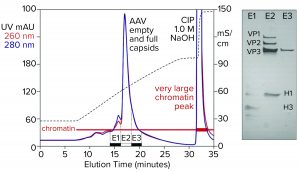
Figure 5: Cation-exchange capture on CIMmultus SO3 (8 mL) column; sample is AAV8 lysate after chromatin reduction by CIMasphere technology, with sodium dodecyl sulfate polyacrylamide gel electrophoresis (SDS-PAGE) of AAV peak fractions.
Figure 5 illustrates AAV capture with an SO3 cation exchanger after chromatin reduction by treatment with CIMasphere particles. Sodium dodecyl sulfate polyacrylamide gel electrophoresis (SDS-PAGE) stained with silver shows residual histone contamination in and adjacent to the main AAV peak. Near-equivalent UV absorbance at 260 nm and 280 nm suggests DNA enrichment. Both findings are consistent with contamination by chromatin. The large clean-in-place (CIP) peak displaced by 1 M NaOH was expected because positively charged CIMasphere particles bind DNA-dominant chromatin preferentially. However, up to 80% of host DNA is destroyed by cellular endonucleases before sample preparation treatments (2–5, 12). That leaves a subpopulation of histone-dominant chromatin debris. Histones bind cation exchangers so aggressively that 1 M NaOH is required to remove them. Combining 1 M NaOH with 1–3 M NaCl enhances column cleaning and can be prolonged if necessary to restore baseline column performance.
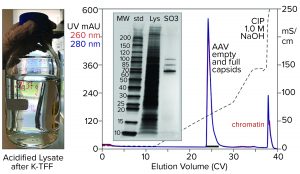
Figure 6: Cation-exchange capture on CIMmultus SO3 (8 mL) column; sample is AAV8 lysate after chromatin reduction by nuclease digestion coordinated with tangential-flow filtration (300-kDa molecular-weight cut-off membrane).
Figure 6 illustrates AAV capture with an SO3 cation exchanger after chromatin reduction by a nuclease-TFF treatment that targets both DNA and histones. Histone contamination of the product fraction is undetectable by SDS-PAGE, and the size of the NaOH CIP peak is reduced as expected. Beyond simply producing a cleaner AAV fraction, this approach minimizes the chromatin load going into the empty–full fractionation step. Excess chromatin interferes with the ability of anion-exchange chromatography to achieve the best separation of empty and full capsids.
TFF coordinated with nuclease treatment also can be applied after treatment with CIMasphere technology. A benefit of that approach is that the use of CIMasphere technology enables samples to be concentrated at least 15× compared with a maximum concentration factor of about 2× without such treatment. Concentration reduces the sample-load volume for the capture chromatography step. It also reduces the amount of nuclease enzyme required to digest chromatin’s DNA component.
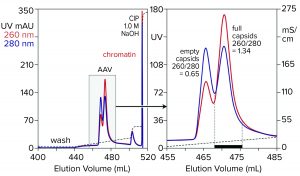
Figure 7: Anion-exchange (CIMmultus QA column, 1 mL) separation of empty and full capsids at pH 9.0 with a salt gradient; sample is AAV8 after cation-exchange capture.
Polishing and Reduction of Empty Capsids By Anion-Exchange Chromatography
Anion-exchange chromatography with salt-gradient elution removes empty capsids from AAV preparations (Figure 7) (13–15). It also removes chromatin remaining after cation-exchange capture. Descending pH gradient elution of anion exchangers supports good resolution among proteins (16), but it has not been reported to achieve separation of empty and full AAV capsids. Elution with ascending pH gradients does not work with strong anion exchangers because protein binding becomes stronger as pH increases. That results from the proteins’ positive charge becoming weaker with increasing pH, which causes them to become increasingly electronegative and strengthens their interaction with the positively charged anion-exchange surface.
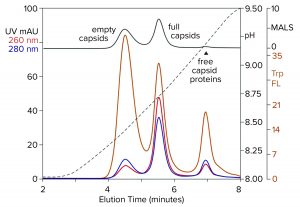
Figure 8: Anion-exchange (CIMac PrimaS column) separation of empty and full capsids with an ascending pH gradient in the absence of excess salts; sample is AAV8 after cation-exchange capture. (Trp FL = tryptophan fluorescence)
Figure 8 illustrates results from a new class of anion exchangers that exhibit their strongest binding of AAV at about neutral pH. Elution is conducted with an ascending pH gradient. Empty capsids elute before and well-separated from full capsids. Multiple monitoring increases the insight that can be obtained. Calculating the ratio of UV absorbance among eluting peaks is established widely as a convenient way to distinguish empty capsids from full capsids. Unfortunately, it is unsuitable for calculating the proportions of empty and full capsids because the extinction coefficients of proteins and DNA differ by a factor of 10–15. That leads to overestimations of the proportion of full capsids. MALS provides a better estimate, but it requires correction factors for differences in size and mass of empty and full capsids. Intrinsic tryptophan fluorescence provides the most objective estimate because it measures only capsid proteins, without requiring compensation to factor out the spectral contribution of DNA, capsid size, and capsid mass.
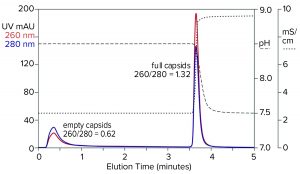
Figure 9: Flow-through removal of empty capsids at elevated pH 8.5 in the absence of eluting salts, followed by recovery of full capsids under physiological conditions; sample is AAV8 after cation-exchange capture.
Step gradient elution can be an attractive method compared with linear gradients for many reasons. Step elution can be performed with less-expensive equipment and fewer buffers. It also requires shorter process times, smaller buffer volumes, higher eluted product concentration, and fewer samples to analyze. Figure 9 illustrates a pH-based step approach. The sample and column were equilibrated to about pH 8.5. The sample was applied, and only full capsids were retained. Full capsids were recovered in a step to physiological conditions.
Despite the attractions of step gradients, linear gradients always support better reproducibility. The degree of charge differentiation between empty and full capsids is small. In turn, the conditions for eluting empty capsids are very similar to those to elute full capsids. Close similarity of elution conditions leaves the separation vulnerable to variations in temperature, buffer formulation, lot-to-lot differences among chromatography media, chromatograph configurations across process scales, and other variables. Even small variations can compromise separation and recovery with step gradients. With linear gradients, external variations can cause the profile to shift to the right or left, but the degree of separation among species is conserved.
Assembling All the Elements
AAV is poised to become a major product class in gene therapy. Fulfillment of its potential can be hastened by focusing on a few well-defined industrial imperatives. Application of fast, high-resolution analytical tools ranks first. Confirmation of results with techniques that require weeks to months is not a problem, but relying on them for day-to-day guidance in process development represents a prohibitive burden. Advance reduction of chromatin arguably ranks second because chromatin impairs the function of all filtration and chromatography media and compromises product quality. Tools need to be clean to work properly. Many chromatin-reduction methods known from antibody purification offer starting points for adaptation to purification of AAV. Chromatographic separation of empty and full capsids requires further research and development. Anion-exchange chromatography supports good separation for some serotypes but not for others. That creates a mandate for chromatography suppliers to explore new surface chemistries and methods, with the goal of achieving adequate separation for all serotypes. Until then, ultracentrifugation provides an effective tool.
References
1 AveXis Receives FDA Approval for Zolgensma, the First and Only Gene Therapy for Pediatric Patients with Spinal Muscular Atrophy; https://www.novartis.com/news/media-releases/avexis-receives-fda-approval-zolgensma-first-and-only-gene-therapy-pediatric-patients-spinal-muscular-atrophy-sma.
2 Gagnon P, et al. Nonspecific Interactions of Chromatin with Immunoglobulin G and Protein A and Their Impact on Purification Performance. J. Chromatogr. A 1340, 2014: 68–78.
3 Nian R, et al. Advance Chromatin Extraction Improves Capture Performance of Protein A Affinity Chromatography. J. Chromatogr. A 1431, 2016: 1–7.
4 Nian R, Gagnon P. Advance Chromatin Extraction Enhances Performance and Productivity of Cation Exchange Chromatography-Based Capture of Immunoglobulin G Monoclonal Antibodies. J. Chromatogr. A 1453, 2016: 54–61.
5 Gagnon P, et al. Chromatin-Mediated Depression of Fractionation Performance on Electronegative Multimodal Chromatography Media, Its Prevention, and Ramifications for Purification of Immunoglobulin G. J. Chromatogr. A. 1374, 2014: 145–155.
6 McPhillips M, Ozato K, McBride A. Interaction of Bovine Papillomavirus E2 Protein with Brd4 Stabilizes Its Association with Chromatin. J. Virol. 79(14) 2005: 8920–8932.
7 Knipe D, et al. Snapshots: Chromatin Control of Viral Infection. Virology 435(1) 2013: 141–156.
8 Lieberman P. Chromatin Regulation of Virus Infection. Trends Microbiol. 14(3) 2006: 132–140.
9 Augusto L. Histones: A Novel Class of Liposaccharide-Binding Molecules. Biochem. 42(13) 2003: 3929–3938.
10 Goldblatt D, Bustin M. Antigenicity of Histones in Various Chromatins. Biochim. Biophys. Acta 606(2) 1980: 304–315.
11 Goldblatt D, Bustin M. Exposure of Histone Antigenic Determinants in Chromatin. Biochem. 14(8) 1975: 1689–1695.
12 Tan L, et al. Characterization of DNA in Cell Culture Supernatant By Fluorescence-Detection Size-Exclusion Chromatography. Anal. Bioanal. Chem. 407(14), 2015: 4173–4181.
13 Fu X, et al. Analytical Strategies for Quantitation of Adenoassociated Virus Empty Capsids to Support Process Development. Hum. Gene Ther. Met. 30(4) 2019: 144–152.
14 Lock M, Vandenberghe L, Wilson J. Scalable Production Method for AAV. US Patent US20160040137A1, 11 February 2016.
15 Lock M, Alvira M. Scalable Purification Method for AAV9. World Patent WO2017160360A9, 21 September 2017.
16 Sluyterman L, Wijdenes J. Chromatofocusing: Isoelectric Focusing on Ion-Exchange Columns: Experimental Verification. J. Chromatogr. A 150(1) 1978: 31–44.
Pete Gagnon is chief scientific officer at BIA Separations and a member of BioProcess International’s Editorial Advisory Board; pete.gagnon@biaseparations.com. Maja Leskovec is head of process development, Blaz Goricar is a research scientist, and Aleš Štrancar is chief executive officer, all at BIA Separations; info@biaseparations.com.
