Before a pharmaceutical product is introduced into humans, either in a clinical trial or as a marketed product, virus safety must be evaluated carefully. Virus safety normally is ensured using a
three step complementary approach: selecting and testing cell lines and/or raw materials for the absence of viruses, testing the product at appropriate steps of production, and assessing the capacity of a production process to clear infectious viruses (1). The latter (also referred to as viral clearance) is the subject herein. Spiking studies are conducted to evaluate the capacity of a purification process to clear viruses. Steps that are expected to clear viruses are studied with down-scaled laboratory experiments, in which different types of viruses are introduced deliberately and virus content before and after the step is evaluated. Clearance of a virus is expressed as a reduction factor (RF) calculated as the total virus before a virus clearance step divided by the total virus after the step. It is often expressed logarithmically as a log reduction value (LRV) and calculated as LRV = log10 (RF) (2).
When virus clearance of different purification steps takes place by different mechanisms (e.g., size exclusion and inactivation by detergent), virus clearance of such steps is considered to be additive. By characterizing several steps, total virus clearance can be calculated by adding individual LRV values. Total virus clearance capacity of a purification process should be substantially higher than the potential virus load in the
starting material for purification.
However, virus clearance can be compromised if a process step with potential high levels of virus cross-contaminates a later purification step (carryover). This might occur when operators use the same equipment (e.g., a pH probe or transfer pump) before and after a virus clearance step without effective cleaning that equipment or when aerosols are created in different process steps in open processes in the same room.
To assess the potential impact of carryover from an early purification step to a later one, we have developed a simple equation for calculating and identifying a critical potential carryover (CPCo), which is defined as the volume of carryover that will significantly affect the overall virus clearance of a purification process. Based on this calculation, mitigations can be introduced to prevent such carryovers.
Biomanufacturers should not accept a carryover risk that can be prevented by complying with good manufacturing practices (GMPs). Biopharmaceutical products for human use always should be processed according to GMPs, which state that appropriate precautions should be taken to prevent viral contamination from before to after virus removal and inactivation steps (3).
Calculation of Critical Potential Carryover
To evaluate CPCo of a virus-containing material during a
manufacturing process, the CPCo
volume can be calculated. CPCo is
defined as the maximum volume of a potential carryover that would not compromise significantly the overall virus safety of a final product.
The virus RF of a purification step is calculated as the total amount of virus before that step divided by the total amount of virus after that step (2). If carryover happens during
production, virus content in the output from a step increases and clearance decreases because of the amount of virus present in the cross-contaminating material. True virus
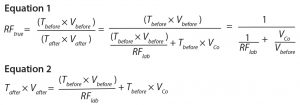
reduction factor (RFtrue) can be calculated according to Equation 1.
The amount of virus content before the step = Tbefore × Vbefore, where Tbefore
is the titer of virus in the material before the step (virus particles per milliliter), and Vbefore
is the volume of material before the step.
The amount of virus after a process step is calculated according to Equation 2, where Tafter is the titer of virus in a material after the process step (virus particles per milliliter),
Vafter is the volume of material after the step, VCo is the volume of carryover, and RFlab is the reduction factor found in the laboratory for that particular process step.
Equation 1 shows that if there is no cross contamination or carryover (VCo = 0), then RFtrue = RFlab. It also shows that the potential cross-contamination will not constitute a
problem to the final virus safety if VCo/Vbefore is much lower than 1/RFlab. So to calculate CPCo, a maximum acceptable value of VCo/Vbefore in comparison with 1/RFlab must be
defined.
Because of the nature of virus clearance, an amount of virus may remain after a virus clearance step. This amount is determined by the amount before (Tbefore × Vbefore) and the reduction factor. If the amount of virus introduced by carryover contamination is of the same magnitude as that remaining after a given step, then RFtrue = RFlab/2, which happens if VCo/Vbefore = 1/RFlab.
Reduction of RF by a factor of two corresponds to a reduction in LRV by 0.3. Because a typical standard deviation for determination of LRV for a single virus clearance step is in the order of 0.5 log10, a deviation of 0.3 log10 will not change dramatically the overall evaluation of virus clearance for a purification process, which typically consists of several virus clearance steps. The volume of a CPCo may be defined as: CPCo = VCo = Vbefore/RFlab.
Based on that, CPCo can be calculated between different process steps, and it can be used for determining carryover volume for a series of successive steps. When those
volumes have been defined for a given purification process, this information can be used to focus on where in a process different segregation measures must be applied. Therefore, such mitigations can be made based on process specific knowledge and
segregation measures in a facility.
Possible Sources of Carryover
To further evaluate the necessity of possible mitigations, different types of potential carryover should be identified.
Aerosols: Aerosols can have a diameter from 0.01 to 10 µm. Here it is assumed that aerosols that can easily flow in a production room have a diameter of about 0.01–0.1 µm (4). An aerosol with a diameter of only 0.01 µm (10 nm) will not be big enough to carry a single virus particle, but an aerosol with a 0.1-µm diameter will be able carry virus particles. A sphere with a 0.1-µm diameter has a volume of about 5 × 10-16 mL. One liter of air may contain up to 109 particles (4), so even if individual droplets have a very small volume, transfer of material, including viruses, is possible.
Aerosols can be created in a number of scenarios. For example, in an open container with foam, aerosols can be created when bubbles in the foam burst, and aerosols can be formed when the pressure in a pressurized vessel is released. In a worst-case situation for a 1-m3 tank, 1,000 L of air with aerosols could be created even though the pressurized vessel is equipped with a filter through which the air is released (vent filter).
Biomanufacturers typically expect that only a very small fraction of the aerosols released to the air in a room will end up in an intermediate from a later process step. If 0.1% of aerosols should end up in an intermediate at a later step, the volume of those aerosols can be calculated as Vaer = 5 × 10–16 mL × 109/L × 0.001 × 1,000 L = 5 ×
10–7 mL. Consequently, the volume carried by aerosols will be expected to be in the nanoliter range.
Drops: If equipment that is used before a virus clearance step is reused later without proper cleaning before reuse, it could transfer small volumes of virus-contaminated liquid. This could be the case for pH or conductivity electrodes. Potential carryover of small volumes also could happen unintentionally by the actions of personnel who work both before and after a virus clearance step (e.g., with a contaminated glove). Such
carryover might be a few droplets. The volume carried by those drops will be expected to be in the microliter range.
Severe: Higher volumes of carryover could happen if large equipment such as vessels or closed production systems (e.g., chromatography systems) are used without proper cleaning. It also could happen if open vessels are placed near each other, with risks for larger volumes of carryover present. Larger spills from before to after a virus clearance step often can be identified, and the intermediate product can be discarded. A severe carryover can be in the range of milliliters to liters.
Example of Calculating CPCo
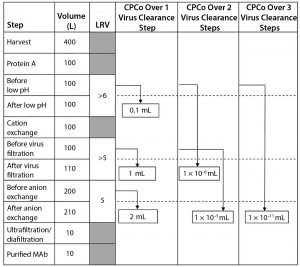
As an example, Figure 1 shows a manufacturing process for a monoclonal antibody (MAb) with volumes at different steps and virus clearance values (LRV) for some manufacturing steps. Using the volumes and LRV values in Figure 1, the CPCo for different virus clearance steps can be calculated. For example, CPCo for a low pH step is calculated as VCo = Vbefore/RFlab = 100 L/106 = 0.1 mL. For all three virus clearance steps, VCo can be calculated as VCo = Vbefore/RFlab = 100 L/1016 =
1 × 10–11 mL .
Calculations in Figure 1 show that carryover of a volume corresponding to that one drop will not compromise the clearance obtained by one step with a LRV in the order of ≤5 log. But a volume of carryover larger than 1 mL will compromise each virus clearance step in the manufacturing process in Figure 1. Two virus clearance steps that together
contribute an LRV of >10 log will be compromised by a carryover of even tiny volumes in the order of ≤0.01 µL, and three or more steps might be compromised by small amounts of aerosols.
Determining the Right Approach
Effective virus clearance and appropriate segregation of virus-reducing steps are critical elements in the virus safety of biopharmaceuticals. Segregation overkill will lead to
excessive production costs and can lead to prolonged production times, whereas inadequate segregation will compromise virus clearance and thus the virus safety of a final product.
Therefore, segregation considerations should be considered as part of virus safety, and appropriate mitigations must be in place to protect the virus clearance determined in
laboratory-scale experiments. By defining critical carryover volumes, biomanufacturers can determine which mitigations are appropriate under a range of manufacturing
process conditions. In that way, cost-effective manufacturing can be achieved while maintaining effective segregation strategies.
We have derived a simple equation here to calculate the consequence of cross-contamination or to determine critical potential carryover volumes. As a way of performing a quantitative risk assessment, we have defined a critical potential carryover volume as the carryover volume that will cause a 0.3 log reduction in virus clearance for
an individual process step or for a series of steps. That information can be used to evaluate which types of mitigations are appropriate at different stages of purification procedures. That method does not endorse poor GMP practice and deliberately poor
segregation. It can, however, be useful for illustrating the challenges of maintaining LRV claims and for getting quantitative estimates of the impact of cross-contamination in
different scenarios.
References
1 ICH Q5A(R1): Viral Safety Evaluation of Biotechnology Products Derived from Cell Lines of Human or Animal Origin. International Council on Harmonization of Technical
Requirements for the Registration of Pharmaceuticals for Human Use: Geneva,
Switzerland, 1999.
2 CPMP/BWP/268/95 Note for Guidance on Virus Validation Studies: The Design,
Contribution, and Interpretation of Studies Validating the Inactivation and Removal of
Viruses. European Medicines Agency: London, United Kingdom, 1996.
3 Guidance for Industry, Q7A Good Manufacturing Practice Guidance for Active
Pharmaceutical Ingredients. Food and Drug Administration: Rockville, MD, 2001.
4 Tu KW, Knutson EO. Indoor Radon Progeny Particle-Size Distribution Measurements Made with Two Different Methods. Radiation Protection Dosimetry 24 (1/4) 1988: 251–255.
Corresponding author Per Kærsgaard is a senior development scientist in the Virology department at Novo Nordisk A/S, Hagedornsvej 1, HAD 3.163 DK-2820 Gentofte, Denmark; pekd@novonordisk.com. Søren Kamstrup and Erik Halkjær are principal scientists at Novo Nordisk A/S.


