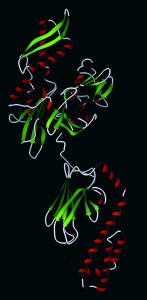
Hsp70 (pdb database 2KHO): Upper nucleotide-binding domain can bind to adenosine triphosphate (ATP) and adenoside diphosphate (ADP), lower is a subtrate-binding domain. (WWW.WIKICOMMONS.COM)
Recombinant therapeutic proteins are commonly produced by cell lines such as Chinese hamster ovary (CHO), human embryonic kidney (HEK) 293, murine myeloma (NS0), and Escherichia coli bacterial cells. Host-cell proteins (HCPs) are indigenous proteins produced by those expression hosts and considered to be process-related impurities generated from the cell culture process (1). HCPs are potentially harmful and immunogenic to patients, and they can compromise the stability of protein drugs (2–4). For those reasons, HCPs must be consistently removed or reduced to acceptable levels during downstream processes to ensure patient safety. Regulatory agencies require manufacturers to adequately control HCP levels, demonstrate of HCP clearance throughout a product manufacturing process, and monitor residual HCP levels in final drug substances and/or products (5, 6).
HCPs are highly variable in composition and abundance, so they present unique challenges in detection and quantification (2, 3). Sandwich immunoassays often are used to simultaneously detect hundreds to thousands of potential HCPs in biologic samples, with enzyme-linked immunosorbent assays (ELISAs) being more common. Immunoassays rely on antibodies generated by immunizing animals such as goats and rabbits with a representative antigen harvest from corresponding null cell lines.
Such assays offer several advantages for HCP quantification. They are highly sensitive, measuring down to single-digit ng/mL HCP levels. They can produce semiquantitative results for many samples rather quickly and are cost-effective in the long term. However, the assay signal is based on immune reactivity of HCPs and reflects antibody binding rather than the mass of HCP that may be present. That makes their results only semiquantitative and specific to each assay system (5, 6). Some HCPs with low immunogenicity may not elicit specific antibodies in immunized animals, so they go undetected by a corresponding sandwich immunoassay. Thus, orthogonal methods often provide complementary information regarding HCP clearance and HCP characterization (2, 3, 7).
Electrophoresis-based methods allow visualization of HCPs by either sensitive protein staining or fluorescence labeling. Although not as sensitive as sandwich immunoassays, these technologies offer valuable size and isoelectronic point (pI) information. Additionally, they can detect HCPs that are not recognized by immunoassays. Combined with immunoblotting and mass spectrometry (MS) approaches, they offer data that complement immunoassay results, such as identities and quantities of specific HCPs. The additional information not only supports the results of those HCP assays, but it also aids in process development and HCP risk assessment (7, 8).
We produced a recombinant fusion protein in HEK cells and purified it with a three-column process. Then we characterized HCPs in the process intermediates and drug substance (DS) using sodium-dodecyl sulfate polyacrylamide gel electrophoresis (SDS-PAGE) and Western blotting. An immunoreactive HCP band appeared throughout the purification process and in the DS samples.
Using liquid chromatography with mass spectrometric detection (LC-MS), we identified the major HCP band as human heat-shock protein 70 (Hsp70). Using a number of electrophoresis and immunoblotting approaches, including two-dimensional difference gel electrophoresis (2D-DIGE) and immunoprecipitation, we confirmed that the main immunogenic HCP was Hsp70. We determined its concentration in the DS using multiple methods, including capillary electrophoresis (CE) Western analysis. Our work suggests that a holistic approach is needed for full characterization of HCPs in recombinant therapeutic protein products. Our results also highlight the importance of incorporating orthogonal methods such as LC-MS and electrophoresis in HCP characterization, identification, and quantification.
Materials and Methods
Recombinant fusion protein, process intermediates, and antibodies against HEK HCP (anti-HEK HCP) were generated internally at Biogen. We purchased anti-Hsp70 polyclonal antibody, a human Hsp70 standard, and an Hsp70 ELISA kit from Enzo Life Sciences. Anti-Hsp70–conjugated agarose beads came from Santa Cruz Biotechnology. We used a 12- to 230-kDa Peggy Sue size-separation master kit and horseradish peroxidase (HRP)-conjugated goat-antirabbit secondary antibody from ProteinSimple. Synthetic stable isotope-labeled peptides of Hsp70 with 15N- and 13C-labeled lysine and arginine residues came from Thermo Fisher Scientific.
SDS-PAGE and Anti-HCP Western Blot: Process intermediates and DS samples were loaded onto a 4–12% Bis-Tris gradient gel (Life Technologies), and electrophoresis was performed according to the manufacturer’s protocol. The protein bands on the gel were visualized with silver stain or SYPRO Ruby stain following the manufacturer’s method (Life Technologies). For Western blotting, proteins on gels were transferred to nitrocellulose membranes using an iBlot system (Life Technologies). Those membranes were probed with anti-HEK HCP or antibodies that recognize specific HCPs. We used HRP-conjugated secondary antibody for HRP-based detection, and for fluorescent-based detection we used Cy2, Cy3, or Cy5 dye-labeled secondary antibodies.
2D Electrophoresis and 2D-DIGE: We performed electrophoresis according to GE Healthcare’s protocol. To prepare for 2D electrophoresis, samples were precipitated and desalted using a 2D Clean-Up kit (GE Healthcare), again according to the manufacturer’s protocol. The resulting protein pellet was resuspended and incubated overnight with dried 11-cm, pH 3–11, nonlinear immobilized pH gradient (IPG) strips (GE Healthcare) for rehydration.
We used an Ettan IPGphor III system (GE Healthcare) for IEF. Immediately following that, IPG strips were reduced and then alkylated in equilibration buffer containing dithiothreitol (DTT) or iodoacetamide. Strips were loaded on top of 4–12% Bis-Tris precast gels (Bio-Rad Laboratories) and sealed with agarose sealing solution. Using the Bio-Rad Criterion Cell electrophoresis system, we ran the gels at 150 V until the dye front ran out of the gel. Resulting 2D gels can be stained using an MS-compatible silver stain kit (Life Technologies) or SYPRO Ruby stain (Life Technologies), or they can be transferred to nitrocellulose membranes for Western blotting.
For 2D-DIGE analysis, samples were precipitated and desalted using the 2D Clean-Up kit. Protein pellets were solubilized and minimally labeled using different CyDye minimal dyes (GE Healthcare) at a ratio of 50 µg protein to 200 pmol CyDye stain. Adding 0.5 µL 10 mM lysine quenched the labeling reactions. After adding an equal volume of 2× lysis buffer containing 2% DTT and 2% v/v pH 3-11NL pharmalytes, we incubated each sample with one dried, 11-cm, pH 3–11, nonlinear IPG strip.
After IEF and SDS-PAGE as described above, we captured 2D gel images using a Typhoon FLA9500 laser imager (GE Healthcare).
Thrombin Digestion: Minimally labeled with Cy3 dye in native condition, 50 µg of DS were digested by 1.5 U of thrombin (Haematologic Technologies) for three hours at room temperature. We minimally labeled an undigested control sample with Cy2 dye in native condition. Both samples were precipitated and desalted using the 2D Clean-Up kit, and dissolved in lysis buffer. We combined the two samples for rehydration by overnight incubation with dried, 11-cm, pH 3–11, nonlinear IPG strips. We prepared a 2D gel as described above and captured images from two different channels (overlaid for analysis) using the Typhoon imager.
In-Gel Digestion and Protein Identification By LC-MS: After silver staining, gel slices were cut for in-gel digestion following a protocol described by Shevcenko et al. (9), except that for staining and destaining we used an MS-compatible silver stain kit. Half of the extracted peptides from each gel slice were injected for LC-MS analysis on a nanoACQUITY ultraperformance liquid chromatography (UPLC) system from Waters coupled online with a Q-Exactive mass spectrometer (Thermo Fisher Scientific). For peptide separation, we used a Thermo PepMap RSLC C18 column (2 µm, 100 Å, 75 µm × 25 cm) heated to 50 °C with a linear gradient of 3% to 30% acetonitrile (ACN) buffer with 0.1% FA at 0.3 µL/min. Identifying proteins with Proteome Discoverer 1.4 (Thermo Scientific), we ran the Sequest search algorithm to search our tandem mass spectrometry (MS–MS) data against a human sequence database.
Immunoprecipitation of HEK HCP and Hsp70: Streptavidin-conjugated agarose beads were washed in phosphate-buffered saline (PBS) with 0.05% Tween 20 (PBST) before one-hour incubation with biotinylated anti-HEK HCP. Then the beads were washed with 100 mM acetate buffer (pH 3.0) and equilibrated to neutral pH using PBST. We then incubated process intermediates or DS samples with the beads for two hours. After washing them with PBST, we eluted the bound HCPs with 100 mM acetate buffer (pH 3.0). Our control immunoprecipitation was prepared using DS with untreated streptavidin beads. To denature the eluates, we heated them with an SDS-containing gel-loading buffer. Then we separated proteins in our denatured samples on an SDS-PAGE gel (visualized using silver stain).
For Hsp70 immunoprecipitation, we used anti-Hsp70 conjugated agarose from Santa Cruz Biotechnology. Following a similar procedure to that above, we generated supernatant and eluate samples for SDS-PAGE. Protein bands on the gels were transferred to nitrocellulose membranes, and Western blotting was performed using anti-HEK HCP and anti-Hsp70 antibodies.
Hsp70 Quantification Protocol A (ELISA): Commercial Hsp70 ELISA kits came from Enzo Life Sciences (ADI-EKS-715), and we performed Hsp70 quantification for process intermediates and DSs following the manufacturer’s protocol:
Briefly, Hsp70 standard and samples are incubated in anti-Hsp70 coated wells for two hours. The wells are then washed, and a polyclonal anti-Hsp70 detection antibody is added before samples are incubated for one hour at room temperature. After washes, HRP-conjugated goat-antirabbit IgG is added to the wells, which then are incubated for another hour. The wells are then washed, and a substrate solution is added to each well. After 30 minutes of incubation at room temperature, the reaction is halted by adding a stop solution.
We determined A450 values from each well with a VersaMax plate reader (Molecular Devices) using the SoftMax program (Molecular Devices) for data acquisition and analysis.
Hsp70 Quantification Protocol B (MS): To quantify Hsp70, we mixed two heavy-isotope–labeled peptides (ATAGDTHLGGEDFDNR and LVNHFVEEFK) and spiked them into tryptic DS digests. Nanoflow LC-MS analyzed these samples based on selected ion-monitoring (SIM) acquisition. We set the MS scan with an Orbitrap resolution of 70,000 (at m/z 200), maximum ion injection time of 120 ms, and isolation window of 3 m/z. We used the extracted ion chromatograms (XICs) of the first three isotope precursor ions per targeted peptide for quantification with Pinpoint 1.4 software (Thermo Fisher Scientific). XICs were extracted with a mass tolerance of 3 ppm.
Hsp70 Quantification Protocol C (CE Western): Using ProteinSimple quantitative capillary Western analysis, we performed this experiment in accordance to the manufacturer’s protocol:
Samples are mixed with 5× Master Mix solution containing SDS, DTT, and fluorescence-labeled protein standards, then incubated at 95 °C for five minutes to allow protein denaturation and reduction. Treated samples and a molecular-weight (MW) ladder are loaded onto a 384-well plate. Separation is performed in individual sets of 12 capillaries. Subsequently, resolved proteins are photocrosslinked to a capillary wall. Gel matrices are removed from the capillaries, which are then washed and blocked to prevent nonspecific binding of antibodies. Then the capillary lumen is incubated with anti-Hsp70 primary antibodies, followed by incubation with HRP-conjugated secondary antibody. For the MW ladder, HRP-conjugated streptavidin is applied to bind biotin-labeled protein standards. HRP substrates are introduced to generate chemiluminescence, which is captured by a charge-coupled device (CCD) camera. Compass software (ProteinSimple) automatically converts those signals into electropherograms or gel-like images.
Results
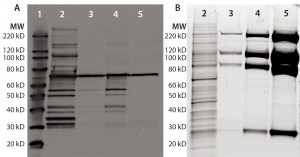
Figure 1: Anti-HCP Western blot and SYPRO Ruby stain of process intermediates and drug substance (DS); equal volumes of harvest (lane 2), column-1 eluate (lane 3), column-2 eluate (lane-4), and DS (lane 5) were denatured and reduced, then loaded onto 4–12% SDS-PAGE. Lane 1 is a Magic Marker molecular weight (MW) marker from Bio-Rad Laboratories. Gels were either transferred to nitrocellulose membrane for anti-HEK HCP Western blotting (a) or SYPRO Ruby stained (b).
A Single HCP Band Remains in Purified Fusion Protein from HEK Cells: Recombinant fusion protein expressed in HEK cells was purified with a three-column process. Rabbits were immunized with HEK HCP antigen produced by culturing HEK cells stably transfected with empty vectors (devoid of product-coding genes) to generate anti-HEK HCP antibodies. Western blots were performed for representative samples after each purification step. In the harvest sample, the antibodies can recognize multiple HCP bands covering a broad MW range (Figure 1a). Those HCPs were significantly cleared through the purification process.
However, we consistently observed one 70-kDa band in process intermediates and DS samples on Western blots. A parallel protein gel stained with SYPRO Ruby dye showed a significant enrichment of the product bands throughout purification (Figure 1b). No major product bands overlap with the 70-kDa Western blot band, indicating that the corresponding 70-kDa protein is probably a small-quantity HCP.
MS Identification of the Immunoreactive Protein Band: Multiple faint protein bands appear around the 70-kDa region in DS samples dyed with SYPRO Ruby stain or silver stain. Some of those minor bands could be product related (e.g., minor clipping or modification of product fragments). To ensure that we excised the correct band for HCP identification by MS, we prepared two parallel 2D gels for Western blotting and silver staining.
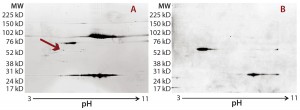
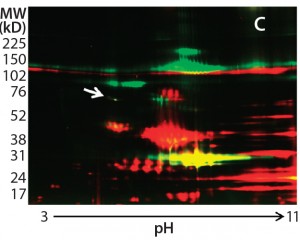
Figure 2: Locating the immunoreactive spot on 2D gels for HCP identification by LC-MS; DS sample was resolved on two identical 2D gels. One 2D gel was stained using a silver stain kit (a); the other was transferred to a nitrocellulose membrane for anti-HEK HCP Western blotting (b). An arrow on the silver-stained gel (a) points to protein spots that matched the Western blot spots (c). Undigested DS sample was labeled with Cy2 dye (shown in green), thrombin- digested DS sample was labeled with Cy3 dye (shown in red). The arrow points to a major 70-kDa HCP spot that was unchanged after thrombin digestion.
As Figure 2 shows, the 2D Western blot highlighted one HCP band around 70 kDa in the DS. We excised (by hand) the corresponding spot on a silver-stained 2D gel (indicated by the arrow) for in-gel digestion and extraction. We analyzed the recovered peptides from that gel slice with LC-MS, identifying them as human Hsp70 peptides. This result suggested that Hsp70 is the major HCP recognized by the anti-HEK HCP antibody in the DS. A nonspecific background band in the Western blot matches one product fragment, so we did not cut that out for further analysis.
In addition to the main product bands, other protein spots in the silver-stained 2D gels showed similar intensity to the Hsp70 spots but were not recognized by the anti-HEK antibody on the Western blot. To confirm that those spots were product-related (not HCPs), we labeled a DS sample with Cy3 fluorescent dye and then subjected it to thrombin digestion. An undigested DS sample was labeled with Cy2 fluorescent dye. Then we combined both samples and separated them on a 2D gel. Figure 2c shows the profiles of those samples in two different channels (shown in red and green).
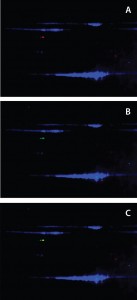
Figure 3: Anti-HEK HCP antibody recognized Hsp70 in DS; a DS sample is labeled with Cy2 (blue) and resolved on a 2D gel. Protein bands were transferred to a nitrocellulose membrane and probed with both rabbit anti-HEK HCP and mouse monoclonal anti-Hsp70 antibodies. Cy3- labeled antirabbit and Cy5-labeled antimouse secondary antibodies were detected on two separate channels using a Typhoon laser scanner; overlay of Cy2 (protein) and Cy3 (anti- HEK HCP Western) channels (a); overlay of Cy2 (protein) and Cy5 (anti-Hsp70 Western) channels (b); and overlay of all three channels (c).
If a protein spot is an HCP or HCP fragment, then it is not likely to be cleaved by thrombin, so its size and charge will remain unchanged. Such protein spots appear yellow in the 2D gel image overlay (overlapping red and green spots). If a protein spot is a product fragment, then it is likely to be cleaved at one or more of the four cleavage sites in the fusion protein. So those protein spots from the two samples will not overlap on the 2D-DIGE gel. As Figure 2c shows, except for one major product band around 25 kDa that was not supposed to be cleaved by thrombin, the only spot appearing in yellow (highlighted by the white arrow) was the 70-kDa spot matching the location of Hsp70.
Other minor fragments seen in Figure 2a were probably product related because they disappeared from their original positions after thrombin digestion. Nonetheless, we also excised those spots for MS-based HCP identification and could identify only product-derived peptides or those from skin-protein contaminates (keratin, actin, democilin, and so on). Data from 2D-DIGE and LC-MS analysis suggested that the other spots on the 2D gels were product-related. Only Hsp70 was the major HCP in the DS, and it was recognized by the anti-HEK HCP antibody.
Confirmation of Hsp70 As the Major Immunoreactive HCP in DS: To confirm that the immunoreactive HCP species in our DS is human Hsp70, we separated DS proteins on a 2D gel and transferred the results to a nitrocellulose membrane. 2D Western blots used both a rabbit anti-HEK HCP polyclonal antibody and a mouse monoclonal anti-Hsp70 antibody. We labeled anti-rabbit and anti-mouse secondary antibodies with different CyDye fluorophores and detected them on two separate channels using a Typhoon laser scanner (GE Healthcare). As Figure 3 shows, both antibodies recognized a 70-kDa protein spot on the membrane. The Figure 3c overlay shows both antibodies recognizing the same protein spot, confirming that the HCP recognized by the anti-HEK HCP antibody is Hsp70.
Additional immunoprecipitation experiments used anti-Hsp70-conjugated agarose beads. The immunoreactive band (presumably Hsp70) disappeared from the supernatant and recovered in the eluate, indicating that immunoprecipitation was successful. When probing the same samples with anti-HEK HCP antibody, we observed a similar result. The immunoreactive band from the original DS sample largely disappeared in the supernatant and mostly recovered in the precipitant, again suggesting that Hsp70 is the major immunoreactive HCP species in our DS (Figures 4a and 4b).
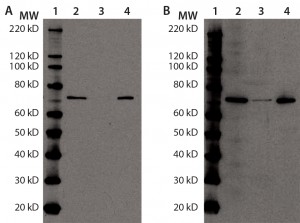
Figure 4a and b: Immunoprecipitation of Hsp70 in DS; for (a) and (b), equal volumes of DS sample (lane 2), Hsp70 immunoprecipitation supernatant (lane 3), and Hsp70 immunoprecipitation eluate (lane 4) were denatured, reduced, and loaded onto two 4–12% SDS-PAGE gels in parallel. Lane 1 is a Magic Marker molecular weight (MW) marker from Bio-Rad Laboratories. Both gels were transferred to nitrocellulose membranes and probed with anti-Hsp70 antibody (a) or anti-HEK HCP antibody (b).
For immunoprecipitation of HEK HCP, we used biotinylated anti-HEK HCP antibody and streptavidin-conjugated agarose beads. A control sample was prepared by incubating the DS and the streptavidin-conjugated agarose beads without antibody present. After incubation, HCPs binding to the beads were eluted and analyzed with SDS-PAGE and LC-MS. As Figure 4c shows, except for product bands and antibody subunits, only one distinct 70-kDa HCP band appears in the silver stain gel. We excised the band and analyzed it by MS, confirming it to be Hsp70.
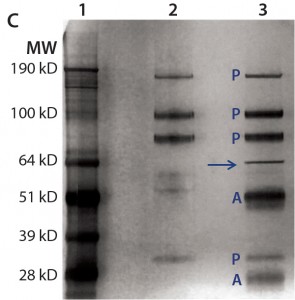
Figure 4c: For immunoprecipitation of HEK HCP in DS (c), the same amount of DS was incubated with streptavidin beads either with (lane 3) or without (lane 2) a biotinylated anti-HEK HCP antibody. Proteins bound to the beads were eluted in acidic buffer and resolved by SDS-PAGE, then the gel was silver stained and product bands identified with a label “P” and anti-HEK HCP antibody bands (heavy chain and light chain) with a label “A.” The unique HCP band around 70 kDa is marked by an arrow.
Quantification of Hsp70 in Different Process Samples: The Western blot and immunoprecipitation experiments confirmed that Hsp70 is the major HCP recognized by the anti-HEK HCP antibody. The 2D gel and 2D-DIGE experiments indicated that Hsp70 is the major HCP in our DS. To assess its safety impact, it is important to know the concentration of Hsp70 in the DS. Initially, we used a commercial ELISA kit to determine the amount of Hsp70 in the process intermediates and the DS. As Table 1 shows, as much as 3 µg/mL Hsp70 were detected in the harvest material. But Hsp70 was efficiently cleared during purification, so we saw a steady decrease of Hsp70 levels, with only 0.5 ng/mL of Hsp70 detected in the final DS.
Based on those results, a >100-fold clearance of Hsp70 occurs from column 2 eluate to DS. However, the Western blot experiment comparing DS and process intermediates showed less-significant Hsp70 reduction by the intensity of 70 kDa bands (Figure 1a). So an orthogonal method is important to verify Hsp70 level in our DS. To this end, we used two isotope-labeled Hsp70 peptides as an internal standard for Hsp70 quantitation with LC-MS. The average result from two independent runs with these two standard peptides was 148 ng/mL in the DS, which was significantly higher than the commercial Hsp70 ELISA’s results.
Given such a large discrepancy between the results from those two quantification methods, we tested a quantitative CE Western-based method with a Peggy Sue instrument from ProteinSimple (10). It uses a capillary SDS-PAGE to separate proteins of interest, then fixes protein bands to the capillary by UV-irradiation for detection by specific antibodies. The chemiluminescence signal from the secondary antibody can be quantified and compared with a signal generated from a series of standards. For quantification, we used a full-length recombinant Hsp70 protein as a standard at concentrations ranging from 50 to 400 ng/mL.
We ran samples at appropriate dilutions and graphed their chemiluminescence signals with a linear-fitted standard curve, then interpolated Hsp70 concentrations from those samples. Table 1 summarizes our results. Repeated experiments consistently showed that the DS sample contains ~300 ng/mL Hsp70. We tested several additional DS batches using the same method, and their Hsp70 levels all fell into the range of 200–350 ng/mL range (data not shown). These values are roughly in line with our MS-based quantification results, all much higher than those from ELISA-based quantification. The CE-Western method gives the most consistent quantification and is also simpler to perform than MS-based quantification. So it is our method of choice for Hsp70 quantification going forward.
Discussion
We have characterized a major immunoreactive HCP band in a recombinant fusion protein DS with traditional SDS-PAGE, Western blotting, and 2D gel methods. The band was excised and identified by LC-MS to be human Hsp70. We used 2D-DIGE Western and immunoprecipitation to confirm Hsp70 as the major HCP in our DS. By multiple methods (including CE-Western analysis), we further determined Hsp70 concentrations in DS samples.
Complementary to immunoassays and electrophoresis methods, LC-MS–based proteomics methods can identify and (to a certain extent) quantify HCPs (7, 8). However, very low-level HCPs in high-concentration protein products present a major challenge to such identification and quantification methods. Most published examples are focused on process intermediates, which had relatively high HCP concentrations (11, 12). Product removal by affinity or ceramic hydroxyapatite columns has been proposed to facilitate HCP detection (2, 3). Identification of hamster phospholipase B-like 2 (PLBL2) in therapeutic monoclonal antibodies using this strategy was published in BPI earlier this year (13). Here, we resolved the problem by identifying a specific HCP band using anti-HEK HCP Western blots, which allowed us to excise the matching band on a 2D-gel for HCP identification by LC-MS. Thus, we successfully identified human Hsp70 as the main HCP in a DS expressed by HEK cells.
LC-MS methods are highly sensitive and can misidentify protein contaminants originating from sample handling as HCPs. In addition to running control samples in such experiments, further confirmation studies should be carried out to ensure that identified HCPs are actually present in the test sample. In our study, we not only confirmed the presence of Hsp70 by Western blotting and Hsp70 specific immunoprecipitation, but also quantified its concentration in DS samples using multiple methods. Such efforts enabled confident HCP quantification and proper risk assessment.
We explored three different methods of Hsp70 quantification and found LC-MS to be the most laborious (thus only DS samples were tested using that method). The two antibody-based methods — a commercial ELISA kit and CE-Western analysis — measured very different Hsp70 concentrations in DS samples but gave relatively similar Hsp70 concentrations for process intermediates. The much higher values of the CE-Western method were in agreement with LC-MS results and more likely to reflect the real Hsp70 concentration in our DS.
The commercial ELISA uses a monoclonal antibody against Hsp70 as a coating antibody and may be more susceptible to interference from high concentrations of product or other proteins. It also detected less Hsp70 in harvest material than did the CE-Western method. Both CE-Western and LC-MS analyses provided robust Hsp70 quantification, with the former being a more rapid and less complicated approach. However, its detection limits are target- and antibody-dependent (10), so CE-Western analysis may not detect HCPs <10–50 ng/mL. By contrast, LC-MS–based quantification can detect them as low as a few ppm (ng/mg of product).
Hsp70 is a chaperone protein residing in the endoplasmic reticulum (ER) of mammalian cells. It plays critical roles in protein folding and trafficking in all eukaryotic cells (14). Released on cell breakage, it is also a common HCP identified in bioprocesses (15). Hsp70 is ubiquitously expressed in human tissues and is also present in human plasma. A number of reports have been published on Hsp70 levels in human plasma, ranging 0.25–1.50 ng/mL in healthy controls (16–19). The Hsp70 level in human plasma can be elevated by stressed or diseased conditions. Furthermore, Hsp70 is constantly turned over in the blood stream, and anti-Hsp70 antibody also is naturally present in human plasma (16). The amount of human Hsp70 introduced through administration of a recombinant fusion protein would be negligible and far below any stress-related Hsp70 release — such as aerobic exercise (17) — and thus should pose minimal risk to patients.
New developments in electrophoresis methods such as 2D-DIGE and CE-Western are excellent tools for HCP characterization. When combined with powerful LC-MS methods, difficult HCP identification and quantification can be achieved with challenging samples such as highly concentrated DS. We have identified a new path forward in HCP characterization, one that ultimately could provide detailed information for process development support and risk assessment.
References
1 Tscheliessnig AL, et al. Host Cell Protein Analysis in Therapeutic Protein Bioprocessing: Methods and Applications. Biotechnol. J. 8(6) 2013: 655–670.
2 Wang X, Hunter AK, Mozier NM. Host Cell Proteins in Biologics Development: Identification, Quantitation, and Risk Assessment. Biotechnol. Bioeng. 103(3) 2009: 446–458. 3 Zhu-Shimoni J, et al. Host Cell Protein Testing By ELISAs and the Use of Orthogonal Methods. Biotechnol. Bioeng. 111(12) 2014: 2367–2379.
4 Gao SX, et al. Fragmentation of a Highly Purified Monoclonal Antibody Attributed to Residual CHO Cell Protease Activity. Biotechnol. Bioeng. 108(4) 2011: 977– 982.
5 Champion K, et al. Defining Your Product Profile and Maintaining Control Over It, Part 2: Challenges of Monitoring Host-Cell Impurities. BioProcess Int. 3(9) 2005: 52–57.
6 Hoffman K. Strategies for Host Cell Protein Analysis. BioPharm 13(6) 2000: 38–45.
7 Doneanu CE, et al. Analysis of Host- Cell Proteins in Biotherapeutic Proteins By Comprehensive Online Two-Dimensional Liquid Chromatography/Mass Spectrometry. MAbs 4(1) 2012: 24–44.
8 Schenauer MR, Flynn GC, Goetze AM. Identification and Quantification of Host Cell Protein Impurities in Biotherapeutics Using Mass Spectrometry. Analyt. Biochem. 428(2) 2012: 150–157.
9 Shevchenko A, et al. In-Gel Digestion for Mass Spectrometric Characterization of Proteins and Proteomes. Nat. Protoc. 1(6) 2006: 2856–2860.
10 Xu D, Mane S, Sosic Z. Characterization of a Biopharmaceutical Protein and Evaluation of Its Purification Process Using Automated Capillary Western Blot. Electrophoresis 36(2) 2015: 363–370.
11 Zhang Q, et al. Comprehensive Tracking of Host Cell Proteins During Monoclonal Antibody Purifications Using Mass Spectrometry. MAbs 6(3) 2014: 659–670.
12 Shukla AA, Hinckley P. Host Cell Protein Clearance During Protein A Chromatography: Development of an Improved Column Wash Step. Biotechnol. Progr. 24(5) 2008: 1115–1121.
13 Vanderlaan M, et al. Hamster Phospholipase B-Like 2 (PLBL2): A Host-Cell Protein Impurity in Therapeutic Monoclonal Antibody Derived from Chinese Hamster Ovary Cells. BioProcess Int. 13(4) 2015: 18–29.
14 Mayer MP, Bukau B. Hsp70 Chaperones: Cellular Functions and Molecular Mechanism. Cell. Molec. Life Sci. 62(6) 2005: 670–684.
15 Tait AS, et al. Host Cell Protein Dynamics in the Supernatant of a MAb Producing CHO Cell Line. Biotechnol. Bioeng. 109, 2012: 971–982.
16 Zhang X, et al. Plasma Levels of Hsp70 and Anti-Hsp70 Antibody Predict Risk of Acute Coronary Syndrome. Cell Stress Chap. 19 March 2010: 675–686.
17 Periard JD, et al. Plasma Hsp72 (HSPA1A) and Hsp27 (HSPB1) Expression Under Heat Stress: Influence of Exercise Intensity. Cell Stress Chap. 17(3) 2012: 375–383.
18 Ogawa K, et al. Plasma Adenosine Triphosphate and Heat Shock Protein 72 Concentrations After Aerobic and Eccentric Exercise. Exerc. Immunol. Rev. 17, 2011: 136– 149.
19 Molvarec A, et al. Serum Heat Shock Protein 70 Levels Are Decreased in Normal Human Pregnancy. J. Reprod. Immunol. 74, 2007: 163–169.
Corresponding author Xiaohui Lu, PhD, is a senior scientist; Chong-Feng Xu, PhD, is a scientist II; Suli Liu, PhD, is a scientist I; Emily Menesale, MS, is an associate scientist III; Li Zang, PhD, is a senior scientist; Dong Xu, PhD, is a scientist II; Zoran Sosic, PhD, is a senior scientist; and Svetlana Bergelson, PhD, is director of analytical development at Biogen, 225 Binney Street, Cambridge, MA 02142; 1-617- 914-7934; Xiaohui.Lu@biogenidec.com.

